Yes, you really can draw!
Posted: August 2, 2018 Filed under: Uncategorized | Tags: drawing, icons, visuals 7 CommentsSummer is a great time to decompress, smell the roses, and try new things. Whether you canoe on a lake, plant a garden, or attend a workshop, you most likely are using these summer months to get to square one, to rediscover the person you really are deep down, and to relax. But then August comes along and with it the new school year, right around the corner. But the new school year also provides teachers with a sense of renewal, a fresh start, a feeling of renewal.
We have heard from many teachers that they would like to start the new school year feeling better equipped to create the tools and charts that will support the instruction they plan to teach with increased ownership and individuality. But then there is always a big “but.” “I don’t know how to draw.” “It takes me too long to make the charts.” “Clip art is great but it takes so much time to find and print out.”
We hear you and in this post we offer some earlier drawing tips and some newer ideas based on what has helped us create the thousands of images and icons we use to create the visual images that support each teaching point we introduce.


Drawing is about learning to look closely, observe shapes, and practicing matching what the eye observes with the hand that holds the pencil. Continued practice increases your eye-hand coordination.


We often use universal icons to represent look, listen, say, and point. Above are some step-by-step visual how-to’s that will help you remember how to draw eyes, ears, mouths, and fingers.


The circle is the most basic shape, the one most young children draw first. The circle is the foundation of drawing people as well as some of the icons you see above, like binoculars, eyeglasses, and a magnifying glass.
If you don’t think you know how to draw, remember to add to that statement, “not yet.” Try following the models we have shared with you here and before you know it, you too will be drawing! The idea is not to draw like DaVinci, but to draw images that simply and clearly convey the messages you are trying to teach. Then you can teach your students how to draw which will open up a whole new world of expression for them as well.
Never worry about perfection, enjoy your trials, and have fun!
Happy Charting!
Marjorie & Kristi
The Power of Ō Can Help You Draw
Posted: March 1, 2016 Filed under: Uncategorized | Tags: charts, drawing, icons, symbols Leave a commentAt Chartchums we use yoga as a way to stretch our bodies and calm our minds. Many yoga classes we attend begin with the chanting of ōm, a mantra that helps bring the mind, body and spirit together for the individual and a sense of combined purpose for all those in the class. The sound of ōm is one of the basic mantras and is a building block for many other mantras used for meditation and enlightenment.
What does this have to do with charts? Well, the power of ōm made us think of the power of ō, which is the primary shape we rely upon when drawing many of the icons and figures that show up on our charts. You are all familiar with the way we use circles to draw people from our past posts, especially the ones on drawing. https://chartchums.wordpress.com/2012/08/29/lets-talk-some-more-about-drawing/ But there are a few more icons that we find ourselves using quite often that start off as an ō (or circle) so we thought we would share some with you here.
A single circle is the start of a magnifying glass, which often indicates some kind of inquiry. It is a visual reminder for children to “look closely” or “take another look” when they are reading, writing, or doing problem solving of any kind, in any subject. The how-to below shows four steps, but you could very easily stop at the second step, especially when speed and simplicity is of the essence.
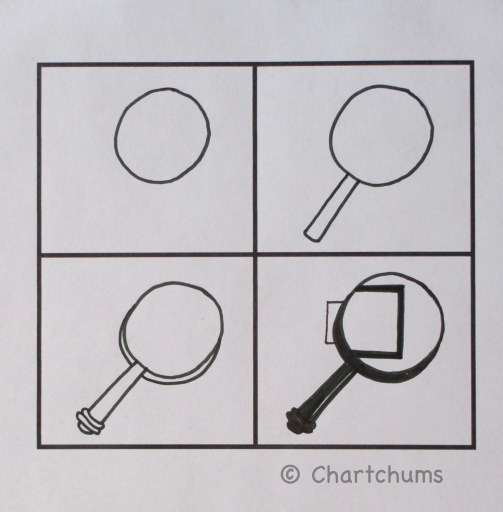
The magnifying glass is a symbol that can be used on charts for any subject matter
A single circle is also the start of the international no symbol which signifies “do not” or “warning” or any action not permitted or wanted. Teachers often use the “no symbol” to indicate “do not” or “be careful” as in “do not run” or “be careful not to slam the door.” The official universal symbol is red with the diagonal line dissecting the circle from the upper left down to the lower right, although black is also typically seen. In the example below we are letting you know not to use a square when making a “no” sign.

This universal symbol is a favorite that works for a variety of purposes
Two ō’s or circles can be used to make anything from bicycles to people, but here we show how two circles can be turned into a pair of eyeglasses and a set of binoculars. Eyeglasses work well to indicate when you want kids to “look” or “see.” The binoculars are a fun symbol to use when the action you want is “zooming in” or looking really closely. As before, you can stop at either step 2 or step 3 depending on your purpose and desire.

The arms of the eyeglasses can be angled inward for a slightly different look
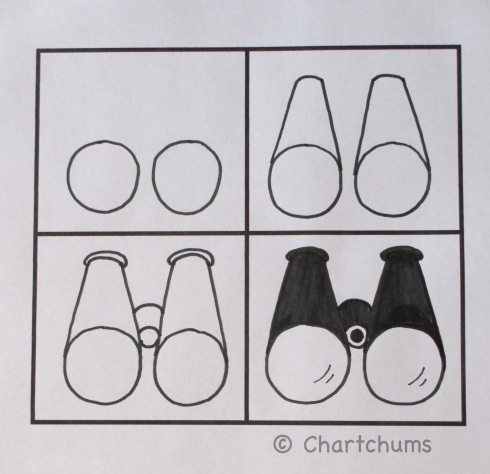
Bringing in an actual pair of binoculars will help kids understand just how much this cool tool can aid in seeing things up close
Of course, as with any drawing lesson, these step-by-step drawing tips are meant to help jump start you to get you going. You will quickly find yourself adding your own details and personality to the drawings you use on your charts. And never worry about a picture or icon being “perfect.” Clarity and purpose should always take priority, as should consideration of time and effort.
With practice, drawing will become easier and faster, as well as more fun. And we all need a bit more fun in our lives. Let us know how it goes, as you use the Power of ō to create charts for and with your kids.
Happy Charting!
Marjorie & Kristi
Professional Book Review: Amplify!
Posted: January 28, 2016 Filed under: Uncategorized | Tags: charts, Reading, technology, video, writing 3 CommentsListen, we are humble ladies here at Chartchums. We like paper; we like markers. One of us still writes her pieces longhand, and the other considers her iPad to be a slightly glorified candy crush machine. We are not on the cutting edge of tech, which is why Katie Muhtaris and Kristin Ziemke’s new book, Amplify!, shocked us to our core with one big idea: you don’t have to be super techie to use tech in big, powerful amazing ways with kids.

Too often technology in education becomes about the tool or the app. One gets a sense that if you don’t have 1-1 iPads for your classroom, you probably should just burn it to the ground. Amplify! pushes back against that idea saying: “We focus on the overall goal of teaching kids how to think and then later in purposeful tools along the way.” This idea, that technology is a purposeful layer added to kids thinking, immediately separates Amplify! from other writings we have read about using technology. It is not about iPads as the new worksheets, or word processing as the new writing workshop — it is about deepening and enriching thinking through the use of everyday technology.
Only have one computer? The authors talk about what you can make possible no matter what your technology provisions.
Not sure where to start? The authors link teaching about using technology to the workshop approach you likely use in reading and writing. The emphasis is on using the technology as a support and enhancement to reading and writing, not as a replacement of the book or the pen.
Worried about screen time and an eerie glow permeating your classroom? The authors teach us how technology can enhance and enrich collaboration and children’s play.
At its core, Amplify! is about good teaching. It is the next step for teachers who believe in child centered, developmentally appropriate, responsive instruction. It is grounded in best practice and powerful learning. You will learn how to use technology in ways that will revolutionize your classroom. One of Kristi’s favorite ideas comes out of one of the “Try It Tomorrow” sections — brilliant bite size ideas to take on called, “The Recording Booth.” Kristi did as the authors suggested and set up her computer and taught her kindergarteners how to record themselves. Once children met a goal, they would record themselves teaching their goal to an audience and over time built a virtual help desk for each other. Need help stretching a word? There was a video for that. Need some writing ideas? There was a video for that. Katie and Kristin taught us how to make living breathing charts available to children!
Throughout the book Kristin and Katie demonstrate beautiful teaching, provide possible mentor charts to use with technology, give realistic advice and helpful resources, and most importantly, replace the idea that technology is about something new, and make you realize it is about something better. As they say, “It’s not the tools — it’s about what we do with them that counts.”
We highly recommend Amplify! for both the novice techie and the high flying IT nerd for both its engaging writing, innovative ideas, and inspiring message.
Amplify! is available here: http://www.heinemann.com/products/E07473.aspx
Happy (digital) charting!
Kristi and Marjorie
Bringing Charts Home
Posted: November 10, 2015 Filed under: Uncategorized | Tags: agency, charts, communication, home-school 6 CommentsCreating and maintaining home-school connections is something most schools strive to put into place and keep going across the school year. Newsletters, memos, meet the teacher nights, conference days, report cards, and homework are some of the ways schools typically communicate with families. But even with all these efforts to partner with parents, parents can still feel sidelined, mere spectators in their child’s education. Helping parents communicate well with both their child and their child’s teacher is one way to invite parents into this world called school.
Learning the language of school is no easy task when you are not living and breathing it day in and day out. But guess who can be our home-school ambassadors? Our children! Yes, students can act as a conduit between what is going on in the classroom and home. And charts can help make sure this information is clearly transmitted. Charts can help parents learn the language of school.
Charts create a method of communication between teacher and parent as the child teaches the parent what the chart is about and what it teaches. Important vocabulary used in school is brought into the home so that a shared language and understanding can be developed. Not only do charts help familiarize parents with what’s going on in the classroom, they can provide specific strategies that parents can point to when trying to help their child with homework.
At PS 29 in Brooklyn, first grade teacher, Maureen Crowley, found that once she started sending copies of charts home her parents felt more connected and better understood what their children were learning as readers and writers. The charts provided a concrete tool they could draw upon when talking to their children about what they were working on in school. Instead of asking, “How was school today?” and getting the proverbial, “Nothing,” parents could now ask more specific questions, like, “Can you retell me one of the books you read today?” or “What did you do to revise your writing today?”
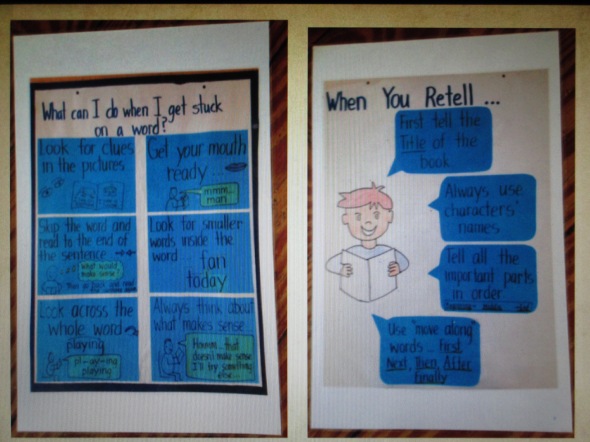
Photos of some classroom charts that Ms. Crowley sent home with her first grade students
Another benefit of sending charts home with children is that it puts the child in charge of their learning. Each child becomes the expert, the one in charge of explaining and using the chart leading to increased agency. Charts sent home can anchor children in the work of school, even when they are at home. And charts provide children with a tool they can use to help themselves when stuck.
One way charts can become accessible in the home is to turn the refrigerator door into a bulletin board. Reading charts, writing charts, and personal word walls can be hung up with magnets. And since the kitchen is often the heart of the home it can spark some great conversations about what the child is working on in school.

The refrigerator makes a great billboard for charts
Bringing charts home can also bring about other positive effects, such as children creating their own charts as needed. For example, when our editor, Zoe White’s daughter, Anna, was trying to get better at getting ready for school in the morning she decided to make a chart that she could use to make sure she didn’t forget anything in the often harried mornings before school. And the best part is that it worked!

Anna’s homemade wake-up chart and checklist
Some ways to send charts home to share with families:
- Place charts in the homework folder
- Puts charts in reading baggies
- Add them to the shared reading folder along with the poems
- Include them in the class newsletter
- Post them on a class blog
- Tweet them out
Teach parents that the purpose for using charts is to teach ways to think: how to organize, be flexible, to plan, to observe, and to use models or mentors. Reinforce the fact that using charts is an act of problem solving, not cheating, and encourages risk-taking and a “can-do” attitude towards any challenge faced by their child. Charts teach, charts support, charts can make you smarter.
Happy Charting! And hoping to see many of you at NCTE in Minneapolis!
Marjorie & Kristi
Getting To The Chart of The Matter
Posted: October 18, 2015 Filed under: Uncategorized | Tags: flexibility, mindset, persistence, resilience, self-control, self-talk 2 Comments(Can’t stop, won’t stop making chart puns!)
Ahhh, October. For some this means country walks and apple cider, for others Halloween decorations and sweets galore, but for teachers, October means that school is really in session. Routines are getting tighter, shyness is dissipating and we are finally getting to know the little (and big) ones that we will spend the next year with in close quarters.
Once the very beginning weeks of school are past, it can be easy to put our sights on November’s reading benchmarks, and parent teacher conferences, and math assessments and on and on and on, and lose sight of what really matters: teaching and coaching into being a resilient and joyful kiddo, who looks at reasonable risks and says “I’ll try” and rebounds from disappointments and failures with his or her spirit intact. As a matter of fact, the New York Times just had an article about the critical need for schools to teach into social skills and positive habits of mind (Why What You Learned in Preschool is Crucial at Work). But how? When? With what?
A Mindset for Learning (and Living)
Kristi (of this blog) and Christine Hertz recently published a book on this very topic, A Mindset for Learning (available here or here) Essentially they argue that it isn’t about adding a new curriculum to your already full day, but rather rethinking the curriculum you already have in ways that support flexibility, resilience, optimism, empathy, and persistence. It is not about doing some more, it is about doing something differently.
Through storytelling, reflection, goal setting, read alouds, and self-talk, we can help children learn to be all of those things so that they have a lifetime of positive and powerful experiences, while at the same time helping children meet benchmarks and standards.
But What Does This Have to Do with Charts?
Charts are the footprints of teaching, and all charts gear towards growth mindsets because they say, “Look, here is a way to do this tricky thing.” They aid in flexibility and persistence, and they foster independence. Yet, we can also chart habits of mind to help children develop the pro-social skills necessary for learning and life.
Charts Show Us Choices:

The chart above comes courtesy of Christine Hertz, co-author of A Mindset For Learning, as a way to teach her third graders that there are different ways to think about things in the world. This launched an inquiry into things like flexibility and optimism, but also provided a touchstone chart for children to reflect on their own thinking. The chart, made collaboratively over several days, became a way to become metacognitive about the ways our thinking can help, or hurt, our learning and living.
Charts Provide Strategies:

In Kristi’s kindergarten classroom, there were lots of discussions around the facts that brains, like bodies can grow. The children in our classrooms are moment by moment developing the ways they will think about themselves and the world, and so it is imperative that we, as teachers, use the best possible language about children, and teach children to do the same for themselves. Instead of using an end of workshop share (in this case play workshop, though it could be any workshop) to teach more content, Kristi used it to teach into self-talk. No matter how beautiful your instruction, if a child says to his or herself “I can’t do this, it is too hard” that child will not have access to learning. We cannot ignore that the way we think about ourselves affects the way we learn and live.
Charts Provide Power and Agency:

Part of having a mindset for learning as a teacher is understanding that pro-social skills don’t just magically appear, they are actively taught and reinforced by us and others. We would never dream to say to a child “go multiply” if we have evidence they don’t know what that means. The same is true for things like flexibility and optimism, or in this case―self- control. Self-control is not about compliance, it is about being in charge of your own body, and understanding your own ability to deal with feelings that may be overwhelming or intense. Having control over your own body can make you feel powerful and competent, and it is essential that we teach ways to do that. This chart, constructed over a week, presents different ways to gain control over your body when it feels like you can’t. Note the option for a run―we don’t all need quiet to regain control―for some children a sprint down the hallway is all they need to come back to a place of control.
Charts Provide A Vision for a Better World:

In the book, A Mindset for Learning, Christine and Kristi lay out possible ways to build an understanding of pro-social stances, one of which is empathy. This chart was the result of an inquiry around Leonardo the Terrible Monster by Mo Willems and the idea that empathy is knowing how someone feels, and using that to change your actions if you need to. This phrase, “I know how you feel!” hangs in the area of the room where children go to talk about problems. As children talk out issues that arise, they use it to make connections to each other, and to think about what changes might need to be made to make the community run smoother, and relationships more fair.
In Summation…
We chart what we teach, so as you look around the room, in what way do your charts support children developing pro-social skills and positive habits of mind? In what ways do your charts help children see possibilities for themselves and how they relate to others? The things we spend time on becomes the things that children know matter, and as you begin these conversations you will see things like this:

“DJ Pony. She likes to sing. She is optimistic. She is the DJ”
We can teach in a myriad of ways. Let’s choose the ones that foster children as they develop passionate, productive hearts and minds. For more, please check out A Mindset for Learning (available here or here).
Happy Charting!
Kristi and Marjorie
The Magical Art of Organizing Charts
Posted: September 28, 2015 Filed under: Uncategorized | Tags: accessibility, charts, organization 12 CommentsAs another school year begins, we are excited to return to our charting musings here at Chartchums. It was a busy year for both of us as we presented workshops and worked on multiple projects. Kristi published a book with Christine Hertz, A Mindset for Learning: Teaching the Traits of Joyful, Independent Growth (Heinemann 2015) http://www.heinemann.com/products/E06288.aspx that was just released this month (Yay!) and then partnered up with Alison Porcelli and Cheryl Tyler to write a book on Play. You can look forward to that book sometime in the Spring. Marjorie wrote a book with Lucy Calkins and Christine Holley about Kindergarten reading called Becoming Avid Readers, which was part of the TCRWP Reading Units of Study series (Heinemann 2015) http://www.heinemann.com/products/E07693.aspx. Marjorie also oversaw all the charts for the K-5 reading books, illustrating quite a few of them.
When projects come to an end and before new ones begin, starting off with a fresh clean start helps one move forward. Whether you have taught for one year or twenty, the amount of paper and stuff accumulated can become mountainous. Inspired by the book, The Life-Changing Magic of Tidying Up: The Japanese Art of Decluttering and Organizing (Ten Speed Press 2014) by Marie Kondo, who suggests discarding as the first rule of tidying, we thought about how we could apply this to charts so that we start off the year with a fresh and tidy start. Marie Kondo’s only rule about what to keep is to hold each item in your hands and to ask, “Does this spark joy?” For a teacher to be able to answer this question you need to also ask, “Can I use this again?” “Will this save me time?” “Will this engage my kids?”
Marjorie decided to try this out with her own collection of charts, which over the years had filled up several file folders, a few sketch books, and a couple of shopping bags. Kondo suggests gathering every item from the same category together in one place and literally pick up each item, holding it, and asking, “Does this spark joy?”
The idea of gathering everything together from a single category (in this case—charts) is eye-opening. Not only do you see the shear volume of stuff, but you realize how much stuff you had actually forgotten about, amount of stuff you haven’t used in ages. The example below shows a “bag-o-charts” that Marjorie admits she stowed away several years ago. There they were, rolled up, never touched since they were first created and used with children, forgotten.
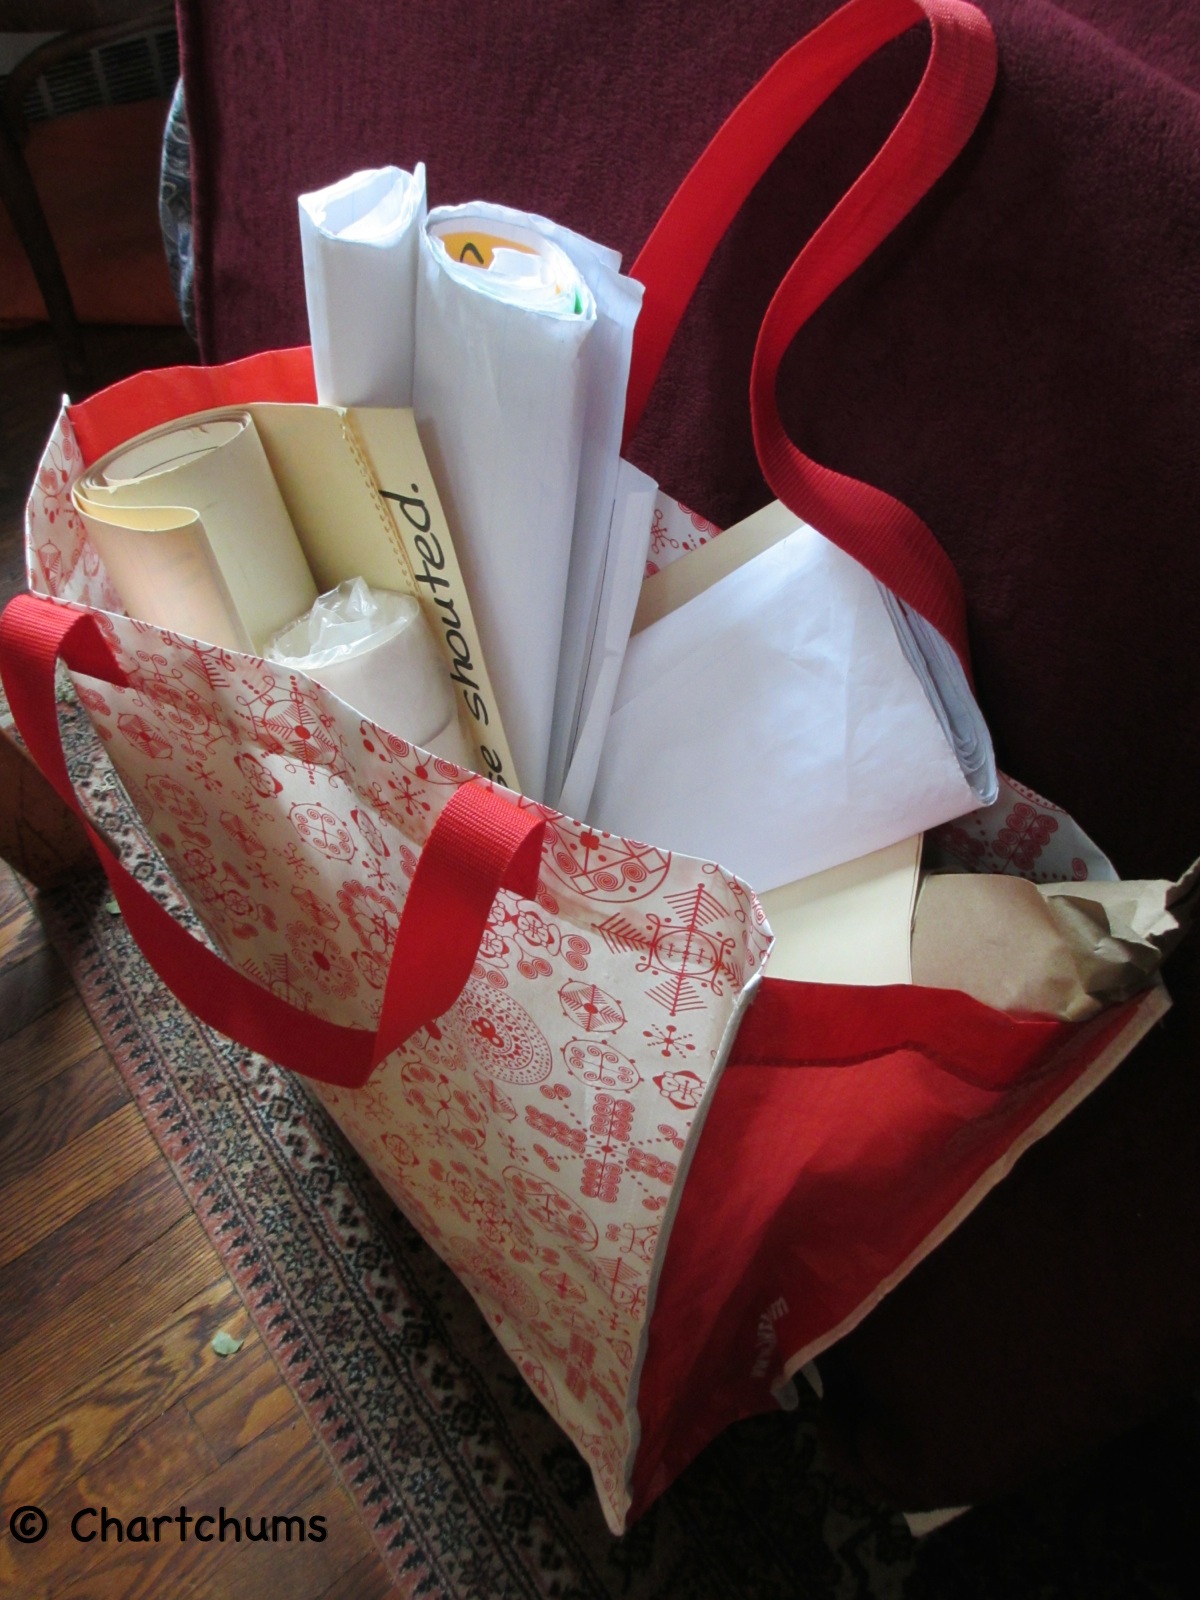
Rolling up charts and putting them in a shopping bag is probably not the most useful storage method nor the best idea.
Taking her next cue from Kondo, Marjorie unrolled one of the charts and asked, “Does this give me joy?” The answer was a definite “NO” as she looked at the wrinkled paper and the faded Post-it notes. Not only did it give no joy, it caused a little embarrassment that she had been holding on to it for all this time. Marie Kondo suggests we can deal with this feeling by thanking the item that has given joy or been helpful in the past before discarding it with a clean conscious. This actually works, so we suggest giving it a try.

Who knew even Post-it notes faded and discolored over time!
Charts are meant to help make our lessons clear and for students to have tools at their ready to be independent problem solvers. Charts are often made or built with the kids using a combination of teacher-made parts and student-made parts. Interactive writing, photos, drawings, and computer-generated images can all be used. How to organize all these charts, especially for the charts that you know will be needed again and again is something to consider and plan for as your charting grows across the year. We have a few simple solutions that will help you organize your charts so they can be easily accessed by you and/or your students.
Many years ago our friend and colleague, Brooke Geller, shared with us her brilliant solution to the problem of not being able to lug around huge chart tablets as she traveled from school to school: a sketchbook! If you create charts using sticky notes or Post-it notes, an 11 x 14 inch sketchbook can be a great storage tool because it is big enough to store four 6 x 8 inch Post-its across two pages. It is also especially useful later on when you want to pull small groups who might need these charts as a refresher to strategies or processes they weren’t ready for when initially introduced.
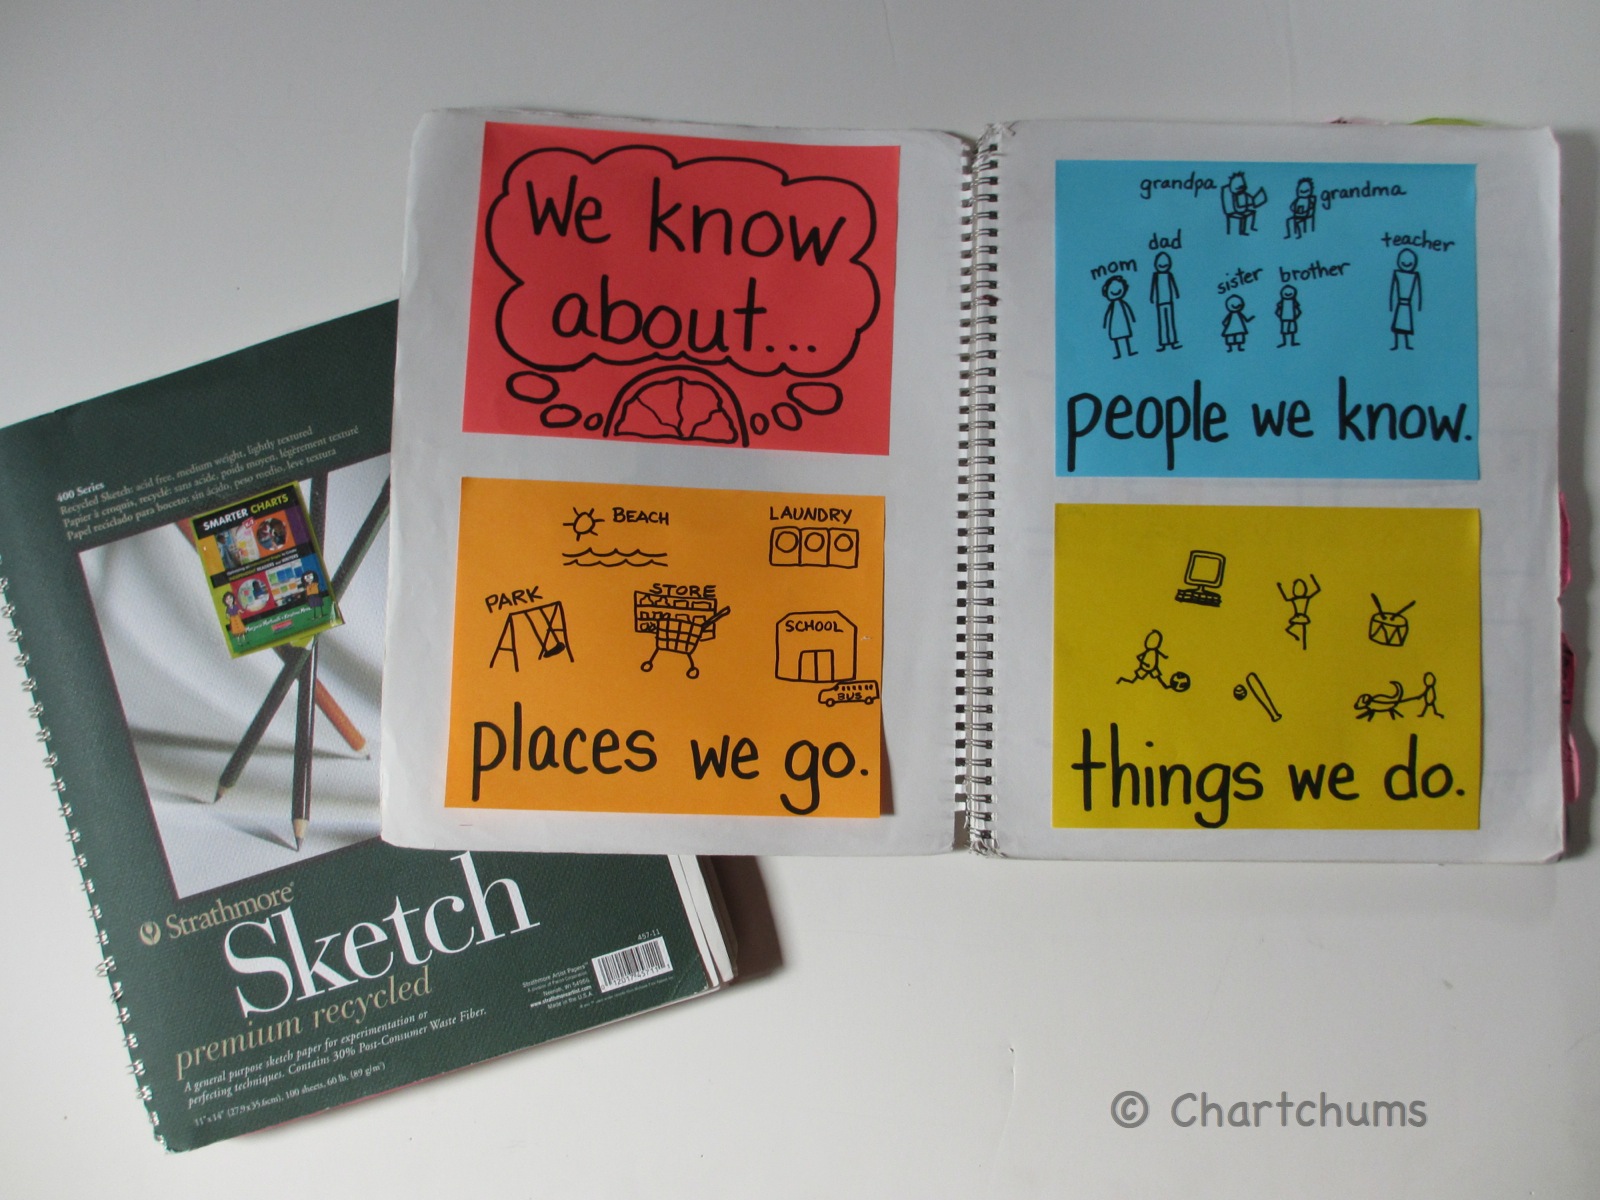
Sketchbooks make charts portable and easily accessible.
Another storage tool is the ever-useful binder. Binders can house photos of charts that are used with certain units of study or the actual charts themselves placed in sheet protectors if you use the Post-it note-like charts. One of the advantages of binders is they can be stored vertically which makes them easy to store and access. As a side note: Marie Kondo discourages piling and prefers vertical storage as it makes items more accessible and visible.
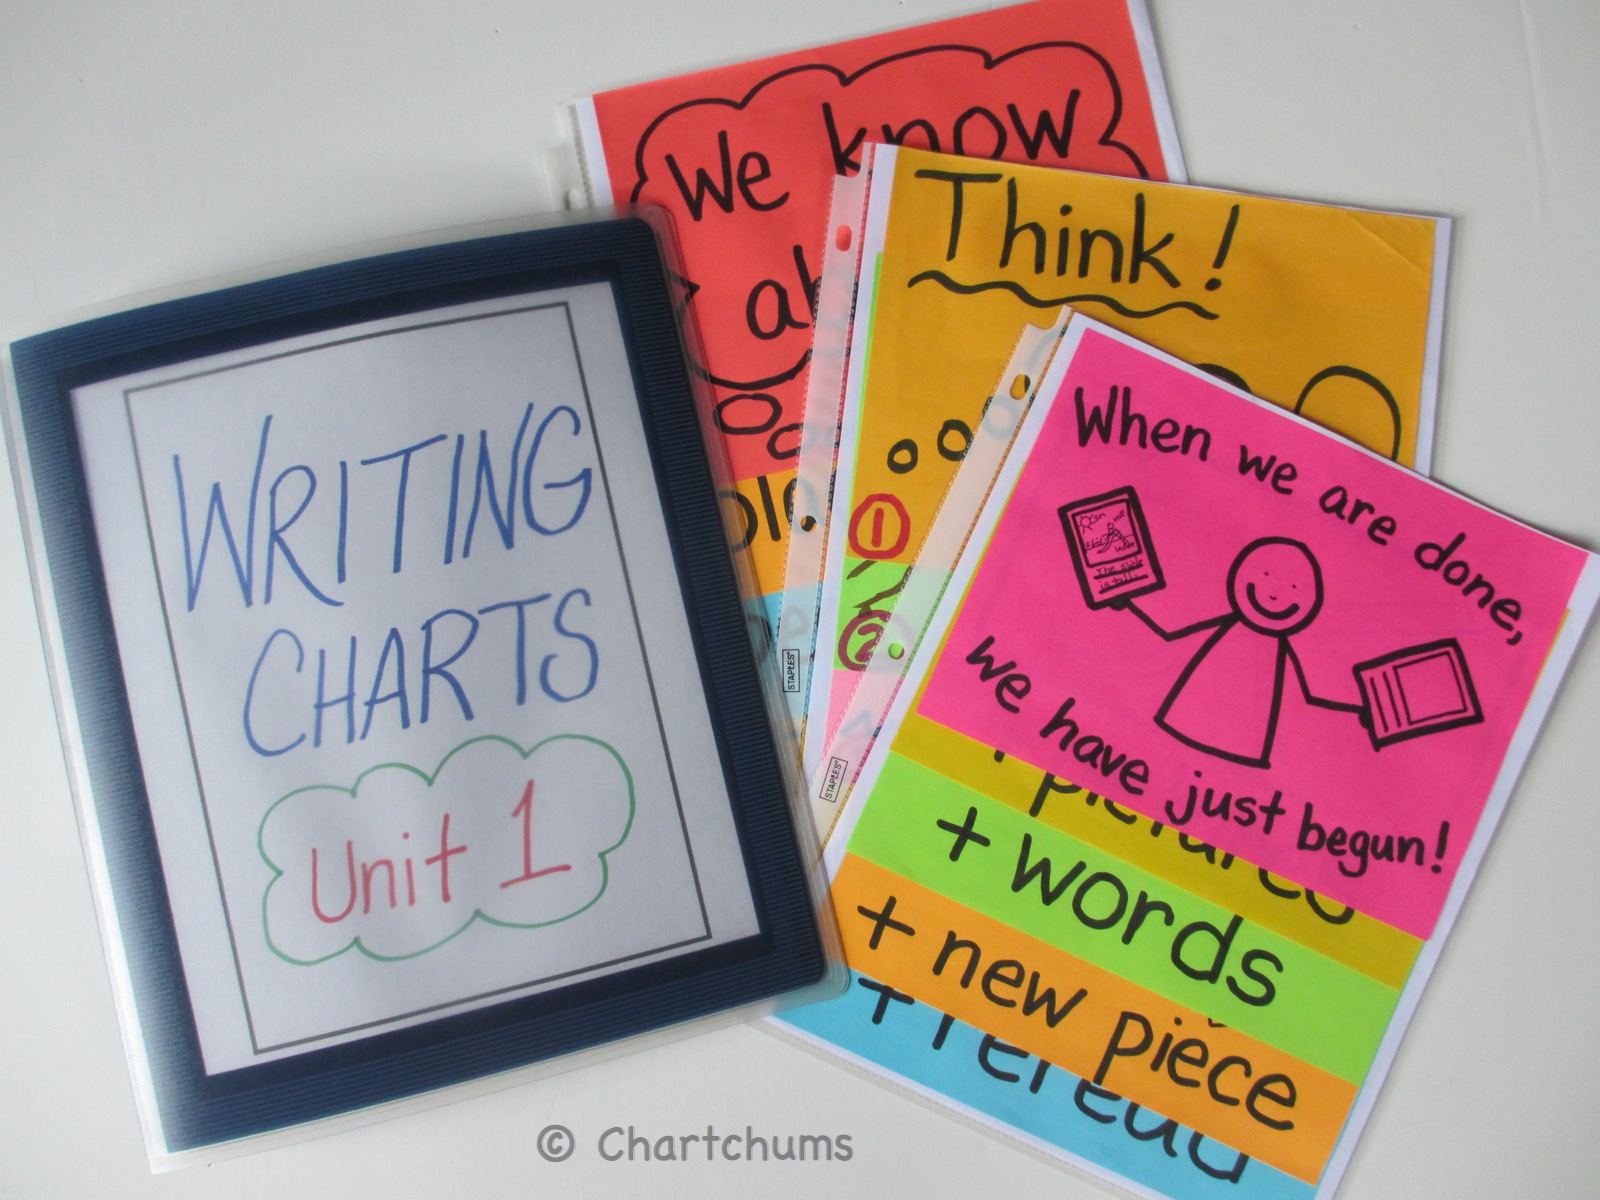
Binders can be created and organized by unit, topic, or skill.
Be conscious of clutter as your year begins, discard what is not needed or no longer “sparks joy” and plan for how to organize all the tools you and your students will be creating this year. Also, let us know what other ideas have worked for you by sharing here on the Chartchums blog or on Facebook.
As always, Happy Charting!
Marjorie & Kristi
Seeing the Matrix: The Reading Strategies Book by Jennifer Serravallo
Posted: May 27, 2015 Filed under: Uncategorized | Tags: book review, charts, Reading, strategies 9 CommentsThere is a scene in the movie The Matrix, where Neo, played by Keanu Reeves, sees the “matrix” for the very first time. The codes and numbers that govern actions become transparent to him, and with ease he is able to deflect punches, fight bad guys, and gaze handsomely into the distance while doing so. (30 bonus points for anyone else who knows what “Keanu” means in Hawaiian.) The rules of the world have become visible, and with access to that knowledge, Neo becomes invincible.
There have been countless times when we have claimed to “see the Matrix,” learning to knit, figuring out a tricky yoga pose, finally assembling that blasted piece of ikea furniture. For many, “seeing the matrix” has become shorthand for suddenly understanding an underlying principal that had seemed magical, or in more common vernacular, for finally “getting it.” Now we have Jennifer Serravallo’s new book, The Reading Strategies Book (available here) to demystify what makes for powerful reading instruction, and make “the matrix” of teaching reading accessible to us all.

The cover and a sample from the table of contents
Jennifer’s book is as visually stunning as it is accessible. She outlines thirteen goals of reading instruction, from engagement to fluency, word solving to comprehension for both fiction and nonfiction, and lays out many many many many strategies to help any child, K-8, achieve each goal. Each strategy has its own page with tips on whom it might help, how you might teach it, prompts you might use, and even a visual cue for a child. Every. Single. One.
Have you wondered how to engage kids whose minds wander?
~There are strategies for that.
Have you wondered how to help emergent readers make sense of books when they can’t yet read the words?
~There are strategies for that.
Have you wondered how to help children wrap their brains around the idea of synthesis?
~There are strategies for that.

We have been fortunate enough to work alongside Jennifer when we were colleagues at the Teachers College Reading and Writing Project. The depth of her knowledge about readers and the art of reading always blew us away and left us often to exclaim, “I wish I could borrow your brain!”
That is exactly what reading this book is like: borrowing the brain of a master reading teacher, one who has an idea for every challenge, a possible answer for every question, and a good idea when you have none. Better yet, Jennifer’s book teaches you how to develop your own expertise. Jennifer’s book doesn’t just teach you about reading, it teaches you how to think about readers.
~The strategies are sound teaching.
~The suggested visuals are clear and engaging.
~The lay out is practical and accessible.
~The book is pretty much genius.

Kristi says: I am entering my fifteenth year of teaching (while never aging a year–it’s miraculous, really) and I am a confident teacher of reading. Within the first 15 pages, I had already used 15 post-its to mark pages, jot thinking, and reflect. New teacher, seasoned teacher, teacher of reading, teacher of humans, this book is important and valuable for every single one of us. See the matrix, become a better teacher for the kids you see every day.
Marjorie says: As I read each strategy I thought of a child who would benefit, not only from the language of the lessons, but the visuals Jennifer has included as well. This book is going to become a permanent part of my conferring toolkit. The organization by goals also helps focus attention on readers, not levels, which makes this book a powerful teaching tool.
Once you have had the pleasure of reading The Reading Strategies Book, leave your thoughts in the comments below. We give it four thumbs up!
Happy charting!
Kristi and Marjorie
(Keanu means “wind over the volcano” and it must be true because I read it in Seventeen magazine 25 years ago ~Kristi)
Chartchums Live! (or as close as we can get)
Posted: May 9, 2015 Filed under: Uncategorized 5 CommentsWe have received numerous requests to visit schools and to present workshops to school districts, but our day to day life in schools makes this difficult to happen as often as we would like. So we have joined with Heinemann to offer our workshops online as a digital course that anyone can sign up for anytime, anywhere, and access is good for one year from signing up.

The amazing team that brought this course to life!
We planned the course with the hope that it would help teachers deepen children’s engagement with charts by teaching how charts can build independence and agency, communicate information efficiently and effectively, and help in setting and achieving goals. There are numerous photos of charts and you can see us “live” through videos of us interacting with children and charts through minilessons, small groups, and conferring and the “pièce de résistance” (at least for us–Kristi and Marjorie) are the chats between the two of us that introduce each session.
Discover new ways to create and use charts with your kids that are based on the science of memory, moving your charting work from good to great.
The course explores the following:
- Understanding the philosophy, theory, and research behind charting
- Learning to plan and prepare different types of charts
- Designing charts using language, visuals, and different tools and techniques
- Teaching with charts
- Exploring charting across the curriculum
To catch a glimpse you can view some short animated video clips through the following link: Chart Tips Live
The course can also be taken for CEU credit. You can go to the Heinemann website for further details: Smarter Charts
We can’t wait to interact with you through this Digital Campus course and to continue to share all that we are learning with you.
Happy Charting!
Marjorie and Kristi
Do Less to Do More
Posted: April 8, 2015 Filed under: Uncategorized | Tags: charts, interactive writing, memory, note-taking, organization, planning, shared writing 4 CommentsHello Friends!
We hope many of you are enjoying the first bits of spring as they (finally) pop up. We find that when spring arrives, so does our desire to streamline, organize, and clear out our spaces at home and in school. In the spirit of mental spring cleaning, today’s post is centered around the idea of streamlining the process of making charts with your students.

Each year we find we do less and less writing and drawing on charts than the year before. There is more student wording, writing, drawing and work captured on the charts hanging in the classroom. Charts are made by the class, for the class. Pulling this off can be tricky, and so we offer a few simple tips to get you started in this practice:
Tip One: Use all the times of the day to make parts of charts
Interactive and shared writing are two fundamentals of the balanced literacy classroom. That time can be leveraged into making charts, as well as pre-teaching or reviewing a concept or strategy. In Kristi’s room, she uses small group word study time as an opportunity to make parts of charts with small groups of kids. At the time when the chart is used, all the parts are put together for the community.

This doesn’t happen every day of the week in the word study, but when it happens it allows a small intimate group a chance to develop wording for a chart, practice their stretching of words, and practice with a concept or skill that they use at other times of the day, such as letter formation, spelling strategies, or punctuation usage.
Additionally, small groups during reading, writing and math, can be pulled to learn a new strategy or refine an existing one, and then afterwards make a chart for the entire community. In this way children get a little extra practice, as well as a feeling of ownership of an important skill or strategy.

Tip Two: See chart making as a time to teach organization, process, and note-taking
In NO WAY are we suggesting that you make every chart with every child. That is a sure fire recipe for disaster. However, making small parts of charts with small groups or in a whole class setting can be an effective and powerful tool for children. When children help to make charts, we have an opportunity to teach the rationale behind them (e.g., “Lets number the steps so we don’t get confused!” or “That part is important to remember, let’s change the color!”) Just as we want children to see us write and read so we can mentor them into being stronger readers and writers, making charts with children in an explicit, clear way you can mentor children into making organized plans for themselves. A share at the end of any workshop can be well spent recording new thinking and learning. Asking children, “What did we just learn? How should we record it so we remember to do it that way again?” helps children understand that part of learning is strategic recording to better help with memory.

Tip Three: Think of charts as disposable, not as artwork
When I need to leave myself a note, I jot it on a sticky note and put it on my laptop. I don’t get a 4X6 frame and hang it up on my wall. Charts are more akin to sticky notes than they are to laminated pamphlets. Freeing yourself from the idea that every inch of it MUST be perfect (that is a backwards B in the word number in the preceding chart), and instead focusing on whether children understand and use it, makes it much easier to ensure that children are engaged in chart making. (As an aside, another child fixed the B shortly after the picture was taken.) If a child draws something to represent an idea on the chart, it does not matter if the drawing makes perfect sense to me, it matters if it makes perfect sense to the children.
Moving forward into the final season of school, we encourage you to pull back the amount you do on charts to make more room for children’s voices. Whether you use small group times during the day or shares at the end of workshop, use the time to teach and reteach skills, mentor organization, and provide scaffolding for the power of a good reminder note.
As always, happy charting!
Kristi and Marjorie
Charting Conversations
Posted: January 21, 2015 Filed under: Uncategorized 1 CommentHappy New Year! Welcoming the New Year involves reflecting on the past year and looking ahead to the year ahead. This usually means making a long list of resolutions for what we will do differently during the new year ahead. While made with the best intentions in mind, New Year’s resolutions are often lofty and ultimately unrealistic and by February many become history.
Rather than making New Year’s resolutions, the focus on reflection can be a much more powerful way to propel a person forward into the New Year. Reflection can highlight past efforts, challenges, and accomplishments, which can be built upon rather than starting completely over. We would like to suggest using the classroom charts to begin these valuable reflective conversations with your students about what was challenging, what they have worked hard to learn and what new challenges they are ready for. Talking about what has been hard or challenging can develop what Carol Dweck calls a “growth mindset” and her research has shown that those with a “growth mindset” thrive on challenges and understand that even failure can be an opportunity for learning and growth (Mindset, 2006). People with a such a mindset are more flexible and less likely to give up or think less of themselves when something is difficult.
The charts in your classroom tell the story of the teaching and learning that has happened since the start of the school year, so offer the perfect way in to having conversations about the children’s efforts to date, their attempts, and their successes and what they might be ready for next. The new year is not for completely new, fresh starts, but a continuation of development and growth which can ultimately lead to a more successful year.
Start with deciding which subject(s) you want to focus on. We suggest looking at the Reading and Writing charts together to reinforce the reciprocity between these two subjects. Math might stand alone or be teamed up with Science. Or Science might be looked at with another inquiry subject such as Social Studies. Once you have decided on the subject(s) you are ready to begin charting conversations.
Then ask children to begin the inquiry by choosing a chart to read over, then they can ask themselves or each other, “What have I learned the most?” “What are some things I want to work more on?” or “What is still kind of hard?” As with any inquiry there are no right or wrong answers, just possible insights or further questions.
Standing back, taking a pause, taking a moment to reflect and ponder, can be a good thing for teachers and students both. This is often a sure-fire way to infuse some fresh energy and commitment to the challenges that lie ahead.
Wishing you all Happy Charting in 2015!
Marjorie & Kristi


