The Magical Art of Organizing Charts
Posted: September 28, 2015 Filed under: Uncategorized | Tags: accessibility, charts, organization 12 CommentsAs another school year begins, we are excited to return to our charting musings here at Chartchums. It was a busy year for both of us as we presented workshops and worked on multiple projects. Kristi published a book with Christine Hertz, A Mindset for Learning: Teaching the Traits of Joyful, Independent Growth (Heinemann 2015) http://www.heinemann.com/products/E06288.aspx that was just released this month (Yay!) and then partnered up with Alison Porcelli and Cheryl Tyler to write a book on Play. You can look forward to that book sometime in the Spring. Marjorie wrote a book with Lucy Calkins and Christine Holley about Kindergarten reading called Becoming Avid Readers, which was part of the TCRWP Reading Units of Study series (Heinemann 2015) http://www.heinemann.com/products/E07693.aspx. Marjorie also oversaw all the charts for the K-5 reading books, illustrating quite a few of them.
When projects come to an end and before new ones begin, starting off with a fresh clean start helps one move forward. Whether you have taught for one year or twenty, the amount of paper and stuff accumulated can become mountainous. Inspired by the book, The Life-Changing Magic of Tidying Up: The Japanese Art of Decluttering and Organizing (Ten Speed Press 2014) by Marie Kondo, who suggests discarding as the first rule of tidying, we thought about how we could apply this to charts so that we start off the year with a fresh and tidy start. Marie Kondo’s only rule about what to keep is to hold each item in your hands and to ask, “Does this spark joy?” For a teacher to be able to answer this question you need to also ask, “Can I use this again?” “Will this save me time?” “Will this engage my kids?”
Marjorie decided to try this out with her own collection of charts, which over the years had filled up several file folders, a few sketch books, and a couple of shopping bags. Kondo suggests gathering every item from the same category together in one place and literally pick up each item, holding it, and asking, “Does this spark joy?”
The idea of gathering everything together from a single category (in this case—charts) is eye-opening. Not only do you see the shear volume of stuff, but you realize how much stuff you had actually forgotten about, amount of stuff you haven’t used in ages. The example below shows a “bag-o-charts” that Marjorie admits she stowed away several years ago. There they were, rolled up, never touched since they were first created and used with children, forgotten.
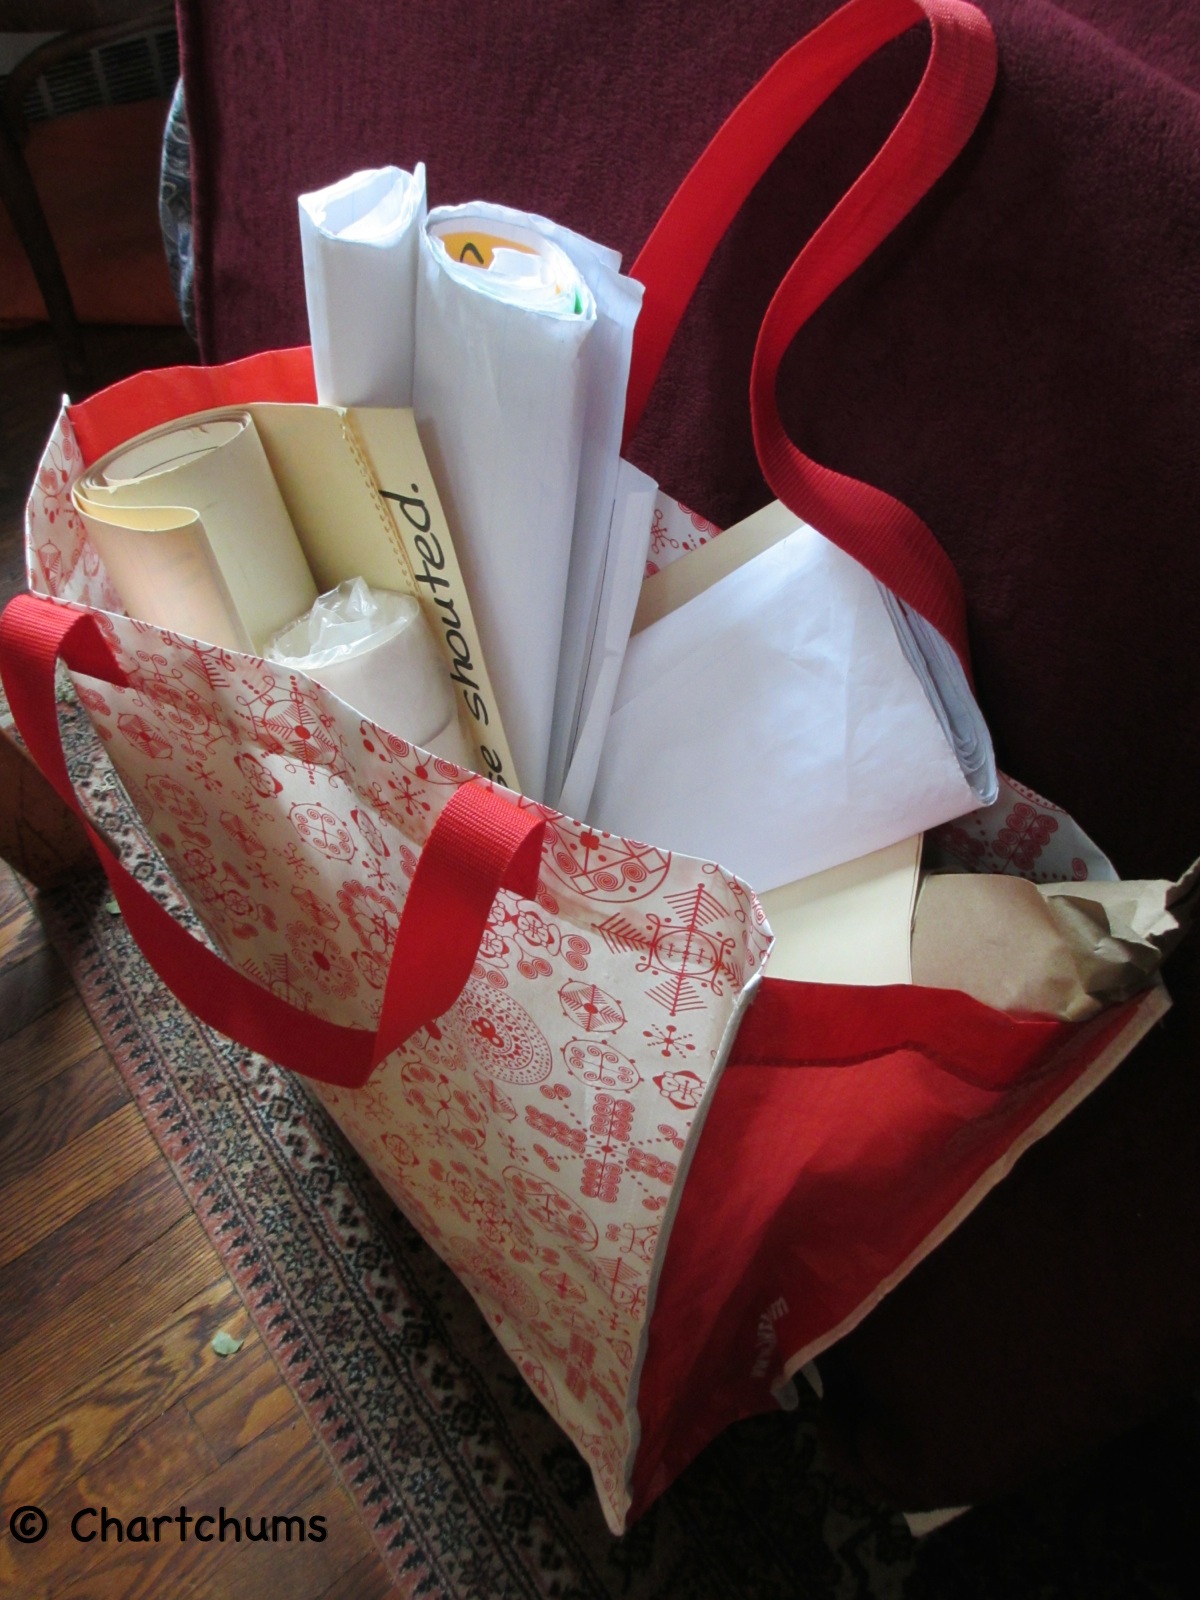
Rolling up charts and putting them in a shopping bag is probably not the most useful storage method nor the best idea.
Taking her next cue from Kondo, Marjorie unrolled one of the charts and asked, “Does this give me joy?” The answer was a definite “NO” as she looked at the wrinkled paper and the faded Post-it notes. Not only did it give no joy, it caused a little embarrassment that she had been holding on to it for all this time. Marie Kondo suggests we can deal with this feeling by thanking the item that has given joy or been helpful in the past before discarding it with a clean conscious. This actually works, so we suggest giving it a try.

Who knew even Post-it notes faded and discolored over time!
Charts are meant to help make our lessons clear and for students to have tools at their ready to be independent problem solvers. Charts are often made or built with the kids using a combination of teacher-made parts and student-made parts. Interactive writing, photos, drawings, and computer-generated images can all be used. How to organize all these charts, especially for the charts that you know will be needed again and again is something to consider and plan for as your charting grows across the year. We have a few simple solutions that will help you organize your charts so they can be easily accessed by you and/or your students.
Many years ago our friend and colleague, Brooke Geller, shared with us her brilliant solution to the problem of not being able to lug around huge chart tablets as she traveled from school to school: a sketchbook! If you create charts using sticky notes or Post-it notes, an 11 x 14 inch sketchbook can be a great storage tool because it is big enough to store four 6 x 8 inch Post-its across two pages. It is also especially useful later on when you want to pull small groups who might need these charts as a refresher to strategies or processes they weren’t ready for when initially introduced.
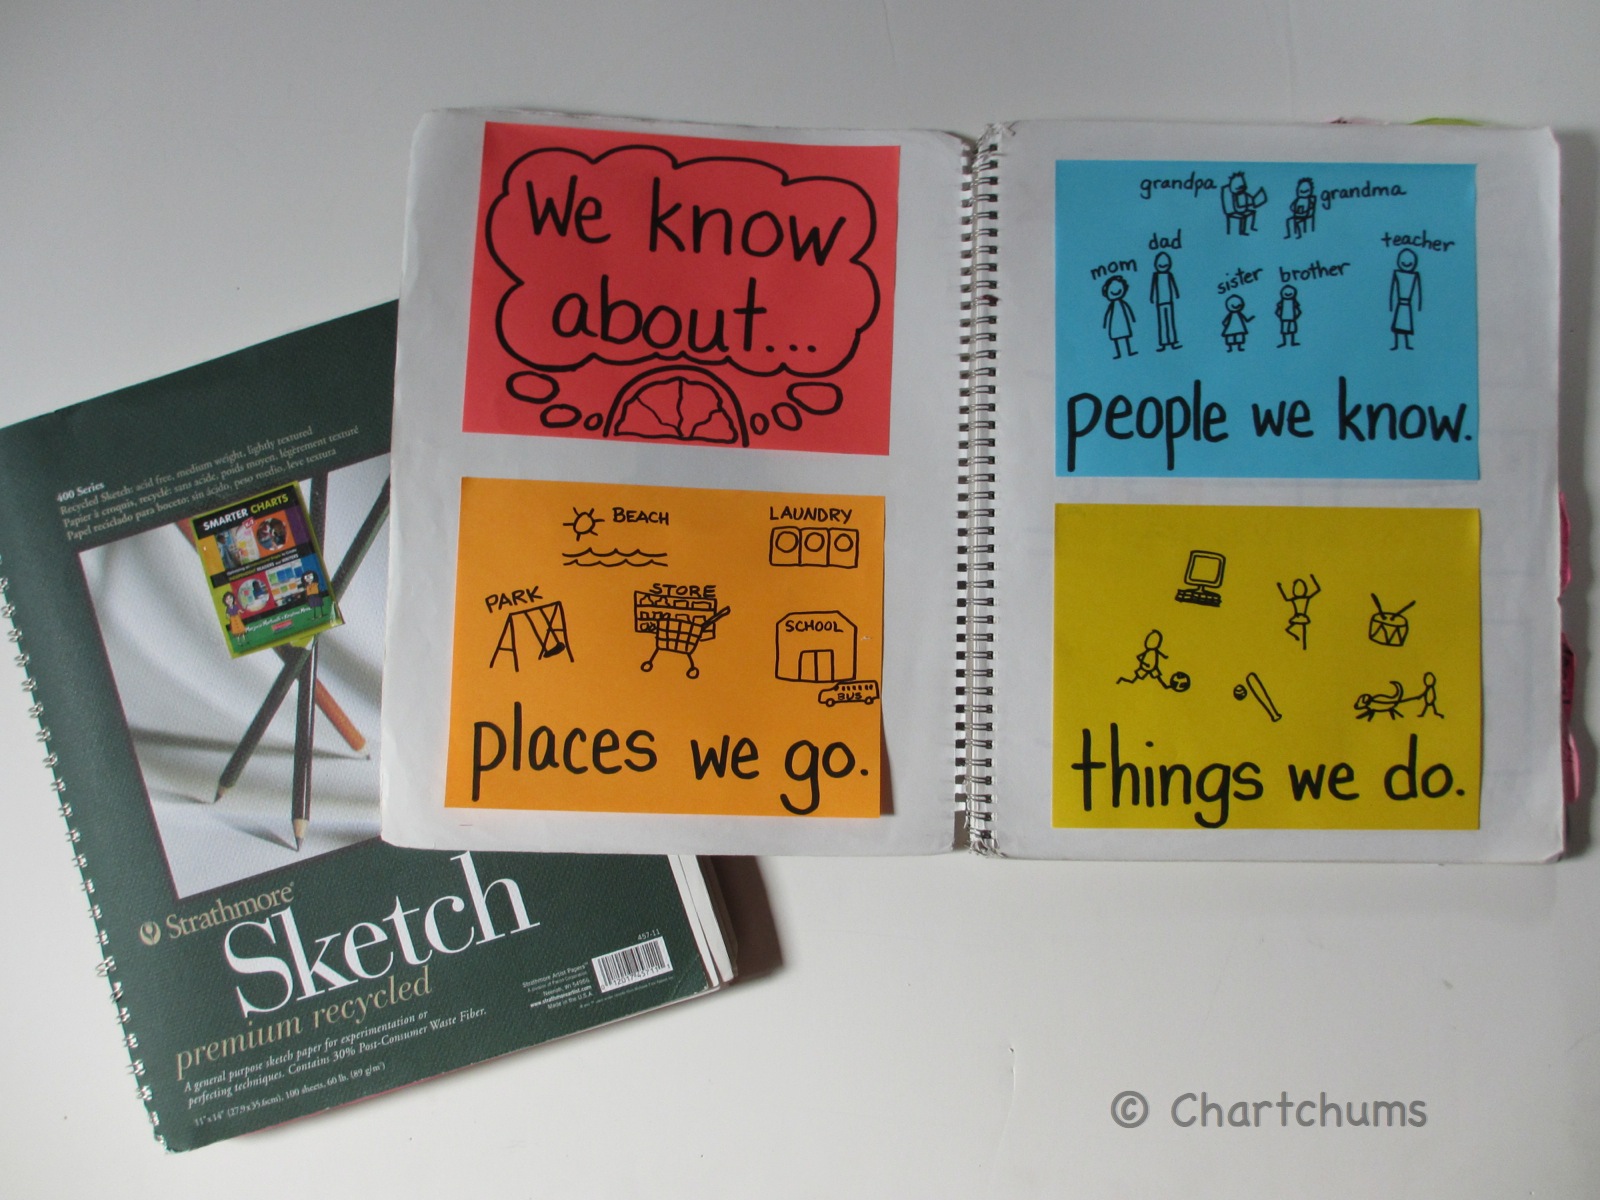
Sketchbooks make charts portable and easily accessible.
Another storage tool is the ever-useful binder. Binders can house photos of charts that are used with certain units of study or the actual charts themselves placed in sheet protectors if you use the Post-it note-like charts. One of the advantages of binders is they can be stored vertically which makes them easy to store and access. As a side note: Marie Kondo discourages piling and prefers vertical storage as it makes items more accessible and visible.
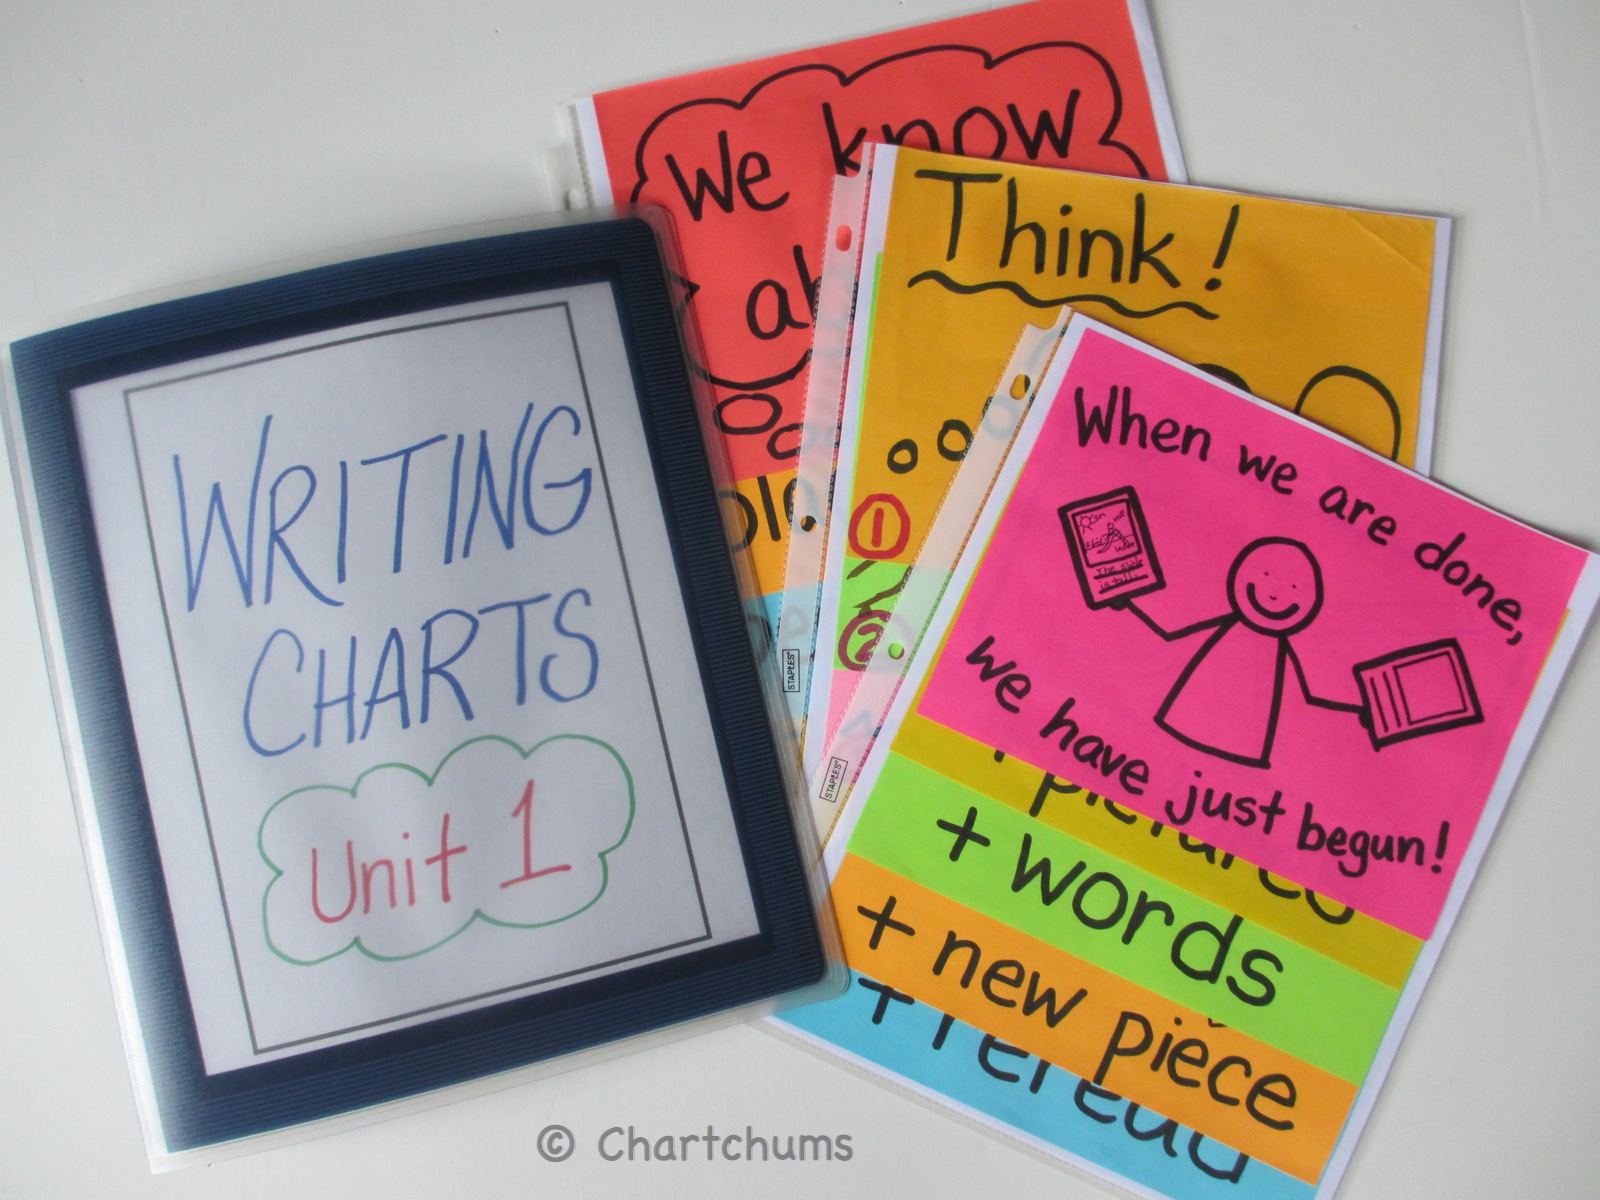
Binders can be created and organized by unit, topic, or skill.
Be conscious of clutter as your year begins, discard what is not needed or no longer “sparks joy” and plan for how to organize all the tools you and your students will be creating this year. Also, let us know what other ideas have worked for you by sharing here on the Chartchums blog or on Facebook.
As always, Happy Charting!
Marjorie & Kristi
Do Less to Do More
Posted: April 8, 2015 Filed under: Uncategorized | Tags: charts, interactive writing, memory, note-taking, organization, planning, shared writing 4 CommentsHello Friends!
We hope many of you are enjoying the first bits of spring as they (finally) pop up. We find that when spring arrives, so does our desire to streamline, organize, and clear out our spaces at home and in school. In the spirit of mental spring cleaning, today’s post is centered around the idea of streamlining the process of making charts with your students.

Each year we find we do less and less writing and drawing on charts than the year before. There is more student wording, writing, drawing and work captured on the charts hanging in the classroom. Charts are made by the class, for the class. Pulling this off can be tricky, and so we offer a few simple tips to get you started in this practice:
Tip One: Use all the times of the day to make parts of charts
Interactive and shared writing are two fundamentals of the balanced literacy classroom. That time can be leveraged into making charts, as well as pre-teaching or reviewing a concept or strategy. In Kristi’s room, she uses small group word study time as an opportunity to make parts of charts with small groups of kids. At the time when the chart is used, all the parts are put together for the community.

This doesn’t happen every day of the week in the word study, but when it happens it allows a small intimate group a chance to develop wording for a chart, practice their stretching of words, and practice with a concept or skill that they use at other times of the day, such as letter formation, spelling strategies, or punctuation usage.
Additionally, small groups during reading, writing and math, can be pulled to learn a new strategy or refine an existing one, and then afterwards make a chart for the entire community. In this way children get a little extra practice, as well as a feeling of ownership of an important skill or strategy.

Tip Two: See chart making as a time to teach organization, process, and note-taking
In NO WAY are we suggesting that you make every chart with every child. That is a sure fire recipe for disaster. However, making small parts of charts with small groups or in a whole class setting can be an effective and powerful tool for children. When children help to make charts, we have an opportunity to teach the rationale behind them (e.g., “Lets number the steps so we don’t get confused!” or “That part is important to remember, let’s change the color!”) Just as we want children to see us write and read so we can mentor them into being stronger readers and writers, making charts with children in an explicit, clear way you can mentor children into making organized plans for themselves. A share at the end of any workshop can be well spent recording new thinking and learning. Asking children, “What did we just learn? How should we record it so we remember to do it that way again?” helps children understand that part of learning is strategic recording to better help with memory.

Tip Three: Think of charts as disposable, not as artwork
When I need to leave myself a note, I jot it on a sticky note and put it on my laptop. I don’t get a 4X6 frame and hang it up on my wall. Charts are more akin to sticky notes than they are to laminated pamphlets. Freeing yourself from the idea that every inch of it MUST be perfect (that is a backwards B in the word number in the preceding chart), and instead focusing on whether children understand and use it, makes it much easier to ensure that children are engaged in chart making. (As an aside, another child fixed the B shortly after the picture was taken.) If a child draws something to represent an idea on the chart, it does not matter if the drawing makes perfect sense to me, it matters if it makes perfect sense to the children.
Moving forward into the final season of school, we encourage you to pull back the amount you do on charts to make more room for children’s voices. Whether you use small group times during the day or shares at the end of workshop, use the time to teach and reteach skills, mentor organization, and provide scaffolding for the power of a good reminder note.
As always, happy charting!
Kristi and Marjorie


