Do Less to Do More
Posted: April 8, 2015 Filed under: Uncategorized | Tags: charts, interactive writing, memory, note-taking, organization, planning, shared writing 4 CommentsHello Friends!
We hope many of you are enjoying the first bits of spring as they (finally) pop up. We find that when spring arrives, so does our desire to streamline, organize, and clear out our spaces at home and in school. In the spirit of mental spring cleaning, today’s post is centered around the idea of streamlining the process of making charts with your students.
Each year we find we do less and less writing and drawing on charts than the year before. There is more student wording, writing, drawing and work captured on the charts hanging in the classroom. Charts are made by the class, for the class. Pulling this off can be tricky, and so we offer a few simple tips to get you started in this practice:
Tip One: Use all the times of the day to make parts of charts
Interactive and shared writing are two fundamentals of the balanced literacy classroom. That time can be leveraged into making charts, as well as pre-teaching or reviewing a concept or strategy. In Kristi’s room, she uses small group word study time as an opportunity to make parts of charts with small groups of kids. At the time when the chart is used, all the parts are put together for the community.
This doesn’t happen every day of the week in the word study, but when it happens it allows a small intimate group a chance to develop wording for a chart, practice their stretching of words, and practice with a concept or skill that they use at other times of the day, such as letter formation, spelling strategies, or punctuation usage.
Additionally, small groups during reading, writing and math, can be pulled to learn a new strategy or refine an existing one, and then afterwards make a chart for the entire community. In this way children get a little extra practice, as well as a feeling of ownership of an important skill or strategy.
Tip Two: See chart making as a time to teach organization, process, and note-taking
In NO WAY are we suggesting that you make every chart with every child. That is a sure fire recipe for disaster. However, making small parts of charts with small groups or in a whole class setting can be an effective and powerful tool for children. When children help to make charts, we have an opportunity to teach the rationale behind them (e.g., “Lets number the steps so we don’t get confused!” or “That part is important to remember, let’s change the color!”) Just as we want children to see us write and read so we can mentor them into being stronger readers and writers, making charts with children in an explicit, clear way you can mentor children into making organized plans for themselves. A share at the end of any workshop can be well spent recording new thinking and learning. Asking children, “What did we just learn? How should we record it so we remember to do it that way again?” helps children understand that part of learning is strategic recording to better help with memory.
Tip Three: Think of charts as disposable, not as artwork
When I need to leave myself a note, I jot it on a sticky note and put it on my laptop. I don’t get a 4X6 frame and hang it up on my wall. Charts are more akin to sticky notes than they are to laminated pamphlets. Freeing yourself from the idea that every inch of it MUST be perfect (that is a backwards B in the word number in the preceding chart), and instead focusing on whether children understand and use it, makes it much easier to ensure that children are engaged in chart making. (As an aside, another child fixed the B shortly after the picture was taken.) If a child draws something to represent an idea on the chart, it does not matter if the drawing makes perfect sense to me, it matters if it makes perfect sense to the children.
Moving forward into the final season of school, we encourage you to pull back the amount you do on charts to make more room for children’s voices. Whether you use small group times during the day or shares at the end of workshop, use the time to teach and reteach skills, mentor organization, and provide scaffolding for the power of a good reminder note.
As always, happy charting!
Kristi and Marjorie
Charts as Pathways to Success
Posted: February 20, 2014 Filed under: Uncategorized | Tags: assessment, charts, goals, independence, mindset, planning, Reading 4 CommentsIn the NCTE position paper on Formative Assessment (October 21, 2013) there is a handy list of ten elements that make up formative assessment. Number five on the list reads:
Requires development of plans for attaining the desired goals.
Hallelujah, we say! So often all we think about is what kids need, or what we need, without quite figuring out how to get there. Its like saying, “I need a million dollars” without having any actual plan to save money, increase your income, or play the lottery. Sad to say making a wish or stating a need alone does not get you the million dollars (but if it does, we will leave our contact information in the comments). Carol Dweck, author of Mindset (2007), and all around intellectual crush of Kristi’s and Marjorie both, speaks to this idea as well. She cites research from Peter Gollwitzer that finds just declaring you will change results in no change at all. Knowing how to get what you need is as critical as knowing what you need. More from Mindset:
What works is making a vivid, concrete plan: “Tomorrow during my break, I’ll get a cup of tea, close the door to my office, and call the graduate school.” Or in another case: “On Wednesday morning, right after I get up and brush my teeth, I’ll sit at my desk and start writing my report.” … Think of something you need to do, something you want to learn, or a problem you have to confront. What is it? Now make a concrete plan. When will you follow through on your plan? Where will you do it? How will you do it? Think about it in vivid detail….These concrete plans – plans you can visualize – about when, where, and how you are going to do something lead to really high levels of follow through, which, of course, ups the chance of success (Dweck, p. 228).
This, dear friends, is where charts come in!
Co-creating a personalized or class chart helps children visualize the attainment of whatever goal they have, which in turn will lead to increased follow through and success. We write down recipes and directions for a reason. It is not enough to know you want to make lasagna, you need the steps to be successful. Once your formative assessments have helped you and your students identify areas of need, charts help everyone get there, they provide the steps. We refer to these particular charts as process charts, and have more about them in our upcoming book, Smarter Charts for Math, Science and Social Studies.
Some Tips:
1. Use your goal (or destination) as your heading. This keeps the focus on the big idea, not the ticky tacky bits that make it up.
2. Use numbers or arrows when appropriate, these small reminders help children be organized in their thinking and their work.
3. Co-construct the chart so that the children visualize alongside you, using their language as much as possible to make the chart meaningful and personal.
4. Use visuals that break down the steps quickly and easily.
Some Examples:
Supporting an Individual Child’s Growth in Reading
Step 1: The Formative Assessment:
Kristi found that this student had a host of snap words he knew by heart in isolation, but when it came time to reading books, all that knowledge flew out the window. His running records showed many miscues for words that he knew on sight. Usage of these words as he read would help his comprehension and his accuracy. As an English Language Learner, this child was at a disadvantage in relying on his syntax, but sight words could be a strength for him to depend on.
Step 2: The Plan
Kristi sat with this child to explain the conundrum, ending with the reason why snap words matter to readers. It helps us understand and read the book, saving our brain energy for the tricky words. The child and Kristi co-constructed a plan: first warm up to remember all the words he knows, then take a book walk to see if he could find any of those words in the book he wanted to read, then read the book.
The when: Before you read
The where: On the snap word list, and in the books
The how: Warm-up and then go!
Supporting Whole Class Growth in Comparing and Contrasting
Step 1: The Formative Assessment
Marjorie asked a group of students to compare and contrast two photos of classrooms from long ago and today and found that many children struggled. Some did not know what to write, some just wrote about one photo, some described what they thought was happening.
Step 2: The Plan
Marjorie designed lessons around the lenses children could use to look at photos, emphasizing that when you look between two items, you always want to ask yourself: what is the same? what is different?
The when: Whenever you have two things in front of you, it is a worthy endeavor to figure out out how they are the same and how they are different.
The where: In social studies, science, reading, writing, math – any of these times could work for comparing two things.
The how: Go slowly and systematically, when you try to see everything you see nothing. Choose one lens at a time and repeat the plan as needed.
Just One More Reason To Love Charts!
Charts are not just descriptive: here is how we did something, they can also be prescriptive: here is how to do something. In a classroom you may have charts that represent both ideas, but the important thing is that you have charts. Charts serve as a way to grow independence, but also as models of ways to achieve success. A thoughtful recording of the where, when, and how is a skill that will help children (and teachers!) for a lifetime.
Share your thoughts in the comments below! Happy Charting!
Kristi and Marjorie
Method to Our (Charting) Madness
Posted: January 4, 2014 Filed under: Uncategorized | Tags: checklists, common core standards, goals, narrative, planning, writing 15 CommentsHi there! Greetings from the snowy, ice covered reaches of New York! We hope today’s post finds you ensconced in covers and drinking the hot beverage of your choice if you are in one of the colder areas of the world. And if you are in Hawaii, well, don’t tell us if you are in Hawaii.
We chartchums have been busy writing, writing, writing and are happy to report that Smarter Charts 2 is now in the hands of the supremely dedicated and talented folks at Heinemann. We will keep you posted on its progression, and have one small teaser to unleash now… it is even better than the first book. Our brains have grown, our community has grown, and it has resulted in something we are both incredibly proud of.
Now onto the short term! January is a time of resolutions, new beginnings, and the reversal of clutter. As Kristi sets forth on launching a new writing unit, she is going to take you on a tour of her streamlined planning/charting process. Pack your bags folks, because here we go:
First things first, look honestly at what your students have learned, not what you have taught
On-demands are one of our favorite ways to launch units. Though the results may not be pretty, they are honest, and you can only get to your destination if you know where you are…
Kristi launched her kindergarten story on-demand with the following language: Today you guys have a pretty exciting job ahead of you! You are going to fill up the pages of your 5 page book with a story of something that happened to you! We have read a lot of stories so you know how they usually start and some of the things they have in them – like talking and feelings. When you have a story idea in your mind, go and grab a special yellow* book from the writing center!”
* Kristi learned this trick from a literacy coach, if you make the on-demand book a different color it is easier to find it. She chooses a different on-demand book color for each unit.
Then, Kristi sat down with the on-demands and her end of unit checklist. The headings at the top are strongly influenced by her work with the Teacher’s College Reading and Writing Workshop Narrative Writing Continuum and the Common Core State Standards. She will be teaching story multiple times throughout the year, so these are not the ONLY things she is teaching in narrative writing this year.
A few notes:
- the first column indicates on how many pages out of the 5 children were able to hold onto the same story
- the stretching column indicates what sounds children are representing (Beginning, Middle, End)
- the final column gives a rough estimate on when children stopped working
After looking at the work, Kristi came up with 4 main goals (in no particular order):
- Build stamina to 30 minutes
- Develop more elaborated drawings
- Develop more elaborated writing
- Increase the clarity and readability of the writing
There are some obvious small groups that pop up: children who need more work with stretching a story across pages or sequencing, coming up with topics, or children who had less than the average amount of stamina.
Now that you know where you are, plan to move onward!
At this point, Kristi grabbed four pieces of white printer paper and wrote the goals across the top (one goal per page). Kristi usually plans for 1-2 weeks of focus around each goal, but will probably only teach 3 or 4 things within that time to support the goal. This allows time for children to learn the new thing, practice and reflect on it.
Below is the planning page for goal 1: Stamina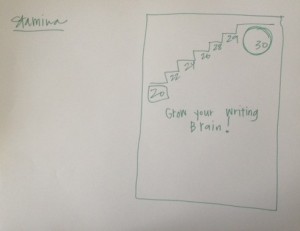 On the left hand side there is space to generate teaching points, on the right hand side is a mock up of what the chart will probably look like. At the top of the chart there will be a stair of increasing minutes to record the growth in stamina. Underneath is the likely heading for the strategies to support increasing stamina. One can not just write longer by sheer force of will, it helps to have some techniques to help you stay at something.
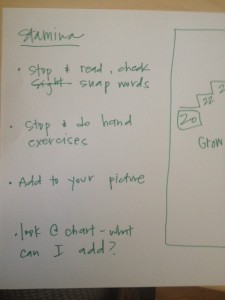 These are the strategies Kristi will likely teach, though she has since added: be optimistic, say, “I can do it” and add to your words. These are culled from a variety of sources: Teachers College Reading and Writing Project curricula, the second bullet comes from our resident occupational therapist, the newly added “be optimistic” comes from some of Kristi’s professional reading on growth mindset and grit. These are written in shorthand and will be mulled over to find the perfect language and the perfect method of delivery, this is the broad strokes of instruction. Next she translates her short hand into a further developed chart sketch.
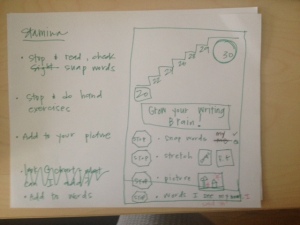 Note the reduction of language, the selection of a consistent visual, and the decision to use two colors to help children see what the strategy may look like in their own work. Next to the second bullet, stretch, Kristi has made a plan for the two photographs she needs to take. Two children that regularly receive additional OT services will serve as the models, mentors, and instructors for that lesson. Much of this sketch is just that, a sketch, much like when baking soda meets vinegar and the substance changes, when chart ideal meets child there must be room made for their influence. Some of this may be made during interactive writing, the work on the right hand side will be selected from students, and the strategies may change based on their accessibility and success. Kristi always, always, always leaves room for the innovation of her class.
Let’s see it again, shall we?
The second goal is elaborated drawings. Again, Kristi went to the white paper and thought about a variety of sources: mentor texts for illustration, Katie Wood Ray’s professional text In Pictures and In Words, resources from the art teacher, etc.
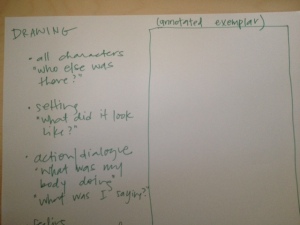 On the left hand side, Kristi has written some language she intends to teach the children, e.g. for drawing characters asking, “Who else was there?” Additionally, Kristi has decided to make this chart an annotated exemplar, meaning that she will use a mentor text, a piece of children’s work, or her own illustration and mark it up for the specifics that make it a successful elaborated illustration. As a stand in, Kristi has decided to sketch her own picture:
 Kristi chose an annotated exemplar as the way to display this, as opposed to a list of strategies as the stamina chart will be, because she wants the children to see the big picture (no pun intended) of illustration. It is as much the way the parts work together, as the parts themselves, that make such impactful pages in picture books. Kristi will likely blow up both a piece of student work and a page from a Marla Frazee book to serve as mentors for the class.
Kristi went through the same process for her remaining two goals, making both a list of possible teaching points and a possible chart for each goal. With all planning, one must be prepared for detours, delays, shortcuts, and running out of gas. Though she is planned, the plans are not poured in cement.
The key to planning, in Kristi’s mind, is clarity of mission. If she can tease out 3 or 4 big goals, she likely has her charts. She often asks herself: what is reasonable in the amount of time allotted in this unit? She gives herself time to revisit teaching with her students, and tries to remember what really matters in writing: active problem solving, clear communication, joy, and ownership.
As far as the charts, the key is remembering they are billboards or fliers for your teaching, they are not the teaching. Door to door salesman leave pamphlets, companies run commercials and print ads, people take notes from a workshop. The charts need to jog your students memories, not create them, so making them with your children is key. Less is almost always more, and pictures are worth a thousand words.
We hope this helps to keep your new year clutter free, and as always, we look forward to hearing your comments!
Happy Charting!
Kristi and Marjorie
“I’m done!” Planning for the Predictable
Posted: September 8, 2013 Filed under: Uncategorized | Tags: charts, planning, revision, writing process 7 CommentsWe know from experience that teaching revolves around the seasons like the earth revolves around the sun. At the start of each school year we resolve to make it the best ever, using all we have learned over the summer and the years past. The challenge is knowing what to continue and what to change. What seems to work year after year? What seems to need revising based on each new group of students entering our classrooms? These questions are what make teaching so invigorating and challenging. It is what keeps us going forward with energy and excitement.
As we began this new school year we found ourselves anticipating some typical scenarios that happen during a writing or reading workshop each and every year. Very quickly we came up with the standard lament heard across the world, “I’m done!” How many of you have already heard this lament? How many times so far? As teachers we have two choices. We can tear our hair out at the instantly greying roots or we can take a breath, smile knowingly, and pull out some full proof plans that have worked again and again in years past.
Well, that is what we have done here. We have taken a breath, smiled knowingly, and pulled out a previous post that deals with this very predictable dilemma that occurs each and every year. “I’m done!” Well, to quote Lucy Calkins and Leah Mermelstein, “When you are done, you have just begun!” Specifically, when it comes to writing it is important that children understand that writing is a never-ending process. This week we revisit Tricia Newhart’s workshop classroom where writers think and plan, sketch and write, and revise with joy! She shows that charts are never static, but grow and change over time. Thank you Tricia for continuing to inspire us all!
Charts, like all living documents, need to be created with your classroom community and grow as you teach more, or as classroom needs change. Below is a series of photos from a first grade classroom that records how the writing process chart grew and changed over the first few days of school. These photos come from the incredible Tricia Newhart, who teaches in Orinda, California. A word about Tricia- when we close our eyes and imagine the ideal “workshop classroom”, Tricia’s room comes to mind. Her responsiveness to children, knowledge about reading and writing, and her absolute fearlessness and bravery in trying new things makes her an inspiration to all!
Here is Tricia’s writing process chart at the very beginning of school. You will notice that she has photos up of children actually doing each part of the chart. Like concrete samples, photos are a great way to capture complex ideas in an accessible way. It also makes the chart tailor-made to each classroom and much more engaging to children. We all tend to look more closely at things when we have been ‘tagged’ in the picture!
At this point, each child has his or her name on a post it, so that they can mark which step of the writing process each child is on. This is a great technique for any chart. Children can put their names on post-its for strategies they want to try, or as Tricia did, to keep track of where they are in a multi-step process.
Here we have that very idea in action!
Here you can see the chart in its final stage stage. Now that children are close to revising, Tricia has added some student work with the actual revisions highlighted in yellow and annotated with sentence strips. If you have been looking close, you will see that the bulk of children moved from planning into the sketching and writing. Tricia is well aware of where they are and taught the next thing that MOST children would need.
Slowly building the chart as needed makes each part more accessible and memorable for children. It also keeps students from getting overloaded from day one. Tricia painted the big picture of the process on day one, but introduced parts more specifically (using post-its to make a plan, ways to revise) as the children needed it.
And one last lovely idea from Tricia:
Here Tricia gives some space for children to put story ideas that pop into their heads during the day. Children can go back to access this during writer’s workshop. Again, the interactive nature of Tricia’s room shows the amount of independence she expects of children and the honor she gives to their thinking and writing.
Enjoy the week ahead and let us know the ways you deal with the expected and the unexpected challenges of teaching and learning!
Until next time, happy charting!
Marjorie and Kristi


