Charting Science Writing (Encore)
Posted: May 5, 2014 Filed under: Uncategorized 6 CommentsWe continue to get requests about ways to use charts in the content areas and our new book, Smarter Charts for Math, Science, and Social Studies: Making Learning Visible in the Content Areas will address those questions in very specific ways. In the meantime, we thought we would bring back the wonderful post on charting science from the amazing teachers at Kiel Elementary School. Enjoy and please share with us some ways you are using charts to help support your children across the day!
We have received many requests from teachers looking for ways to use charts that reinforce their teaching of information writing, so when Katie Wears, a staff developer at the Reading and Writing Project, shared with us some photos of science writing charts her teachers at Kiel Elementary School in Kinnelon, New Jersey had made during their “Writing Like Scientists” unit, we immediately asked if they would share their process with all of us here at Chartchums. They generously agreed and the following guest blog post is the result. Our thanks to Liz Mason, first grade teacher, Jenna McMahon and Nicole Gillette, second grade co-teachers, and to Katie Wears for bringing us all together!
We are honored to be contributing to Chartchums; a place where educators from all over come to collaborate and be inspired by Marjorie, Kristi, teachers, and the students they work with. Thank you for letting us share some of the things we have been working on.
When spring arrived, the teachers at Kiel Elementary School were excited to think more about science and science writing. We planned with each other and brainstormed many possibilities for the science units and how to inspire science writing and thinking. Currently, First Grade is finishing up their study of Properties of Matter and Second Grade is studying Forces and Motion.
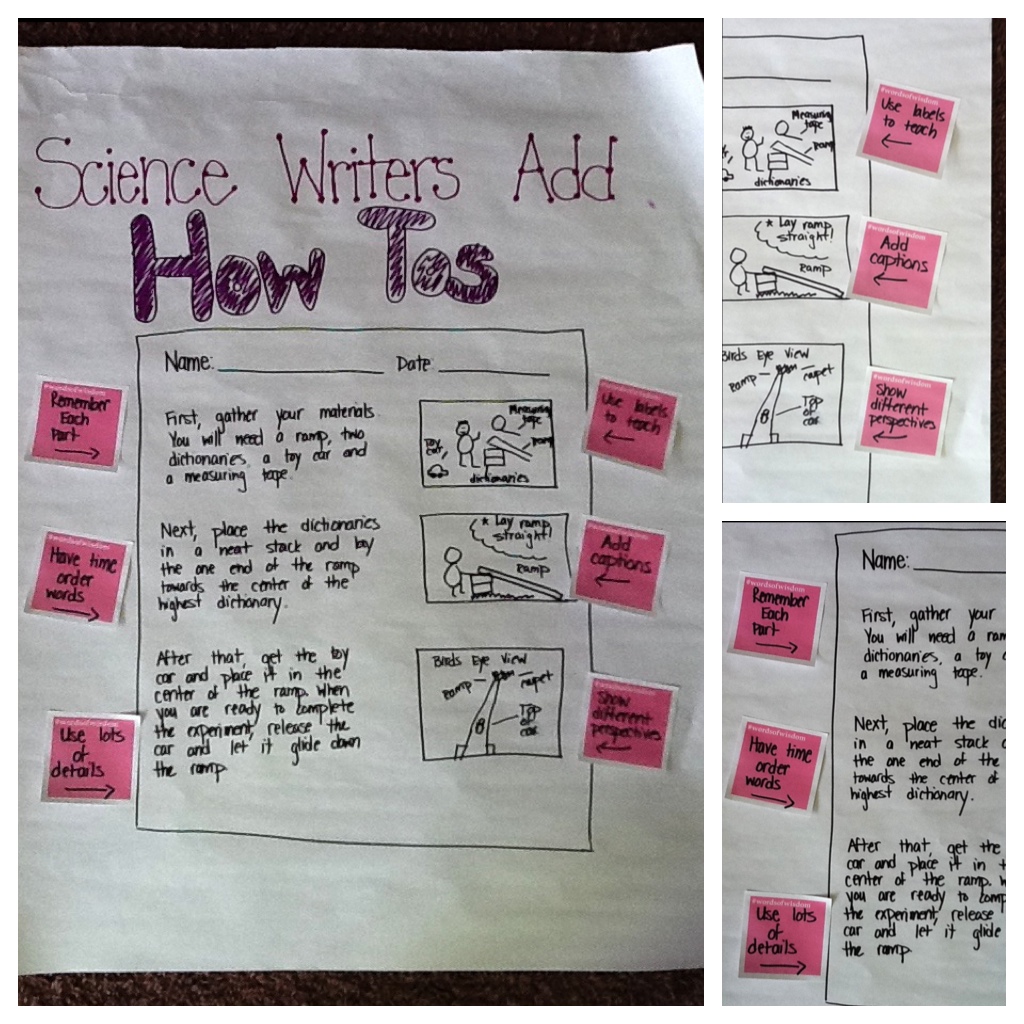
One goal was to help students better understand the scientific process and be able to feel successful with this “new” kind of writing. We created these two charts to provide a scaffold for the students and to support independence with the scientific process and writing about science.


Exemplars were created to give the young scientists a vision of how their writing could go. This chart was created to support students with the procedure part of the lab report. It was exciting to see the children discuss the things they noticed in the exemplars and put those things into their own lab reports. The children were eager to use the exemplars as models for their own writing, to set goals, and to become independent. Young scientists looked at their own writing alongside the exemplars and used the exemplars to give their partners “stars” and “wishes” or compliments and tips.
Here are some other exemplars that were created during the first part of our units.


Another goal of this unit was to increase academic vocabulary. These charts and tools give students the vocabulary they need to share their learning and thinking during discussions and through their writing. The vocabulary was introduced and reinforced through real alouds, shared reading, video clips, experiments and writing. The young scientists use these charts to show everything they know.


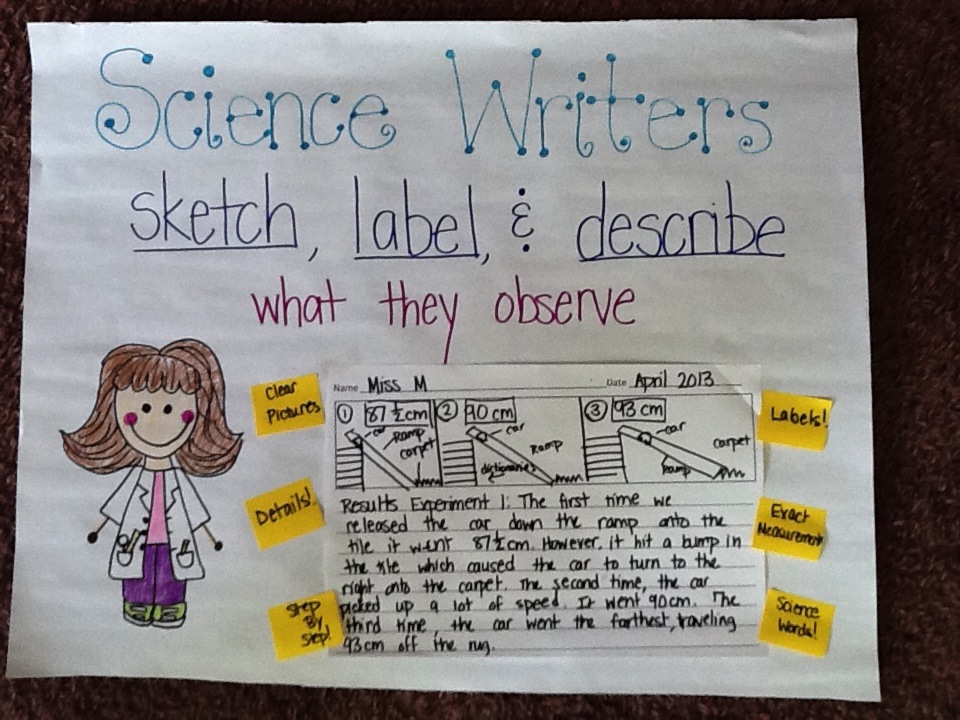
We also wanted the young scientists to be able to use writing and the scientific process to be able to deepen their understanding and thinking. Scientists analyzed their results to draw conclusions and share their thinking. The writing on this chart was done with Jenna’s second grade class during shared writing. The chart was then created during writing minilessons when Jenna and Nicole were teaching students how to develop their conclusions and revise their thinking. They give students a model of how to share their learning through their writing.

Small versions of the charts were made and are available for the young scientists to use.
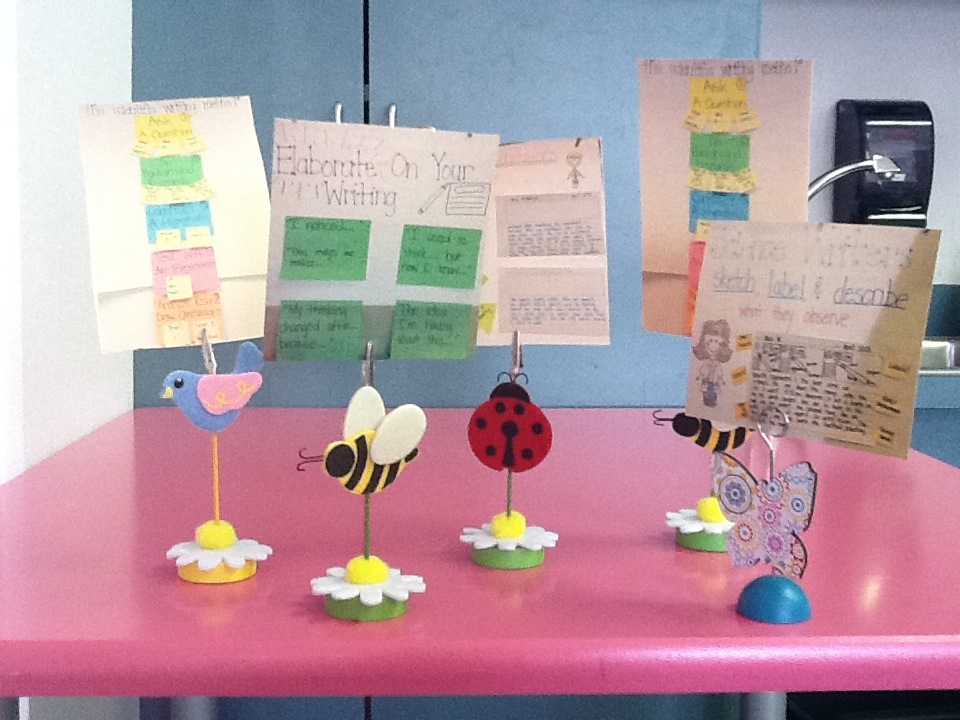
The young scientists are now using these charts and tools to support each other and work collaboratively in science clubs. In their clubs they make decisions, have different roles, formulate questions, and go through the process of gathering the materials to conduct experiments.
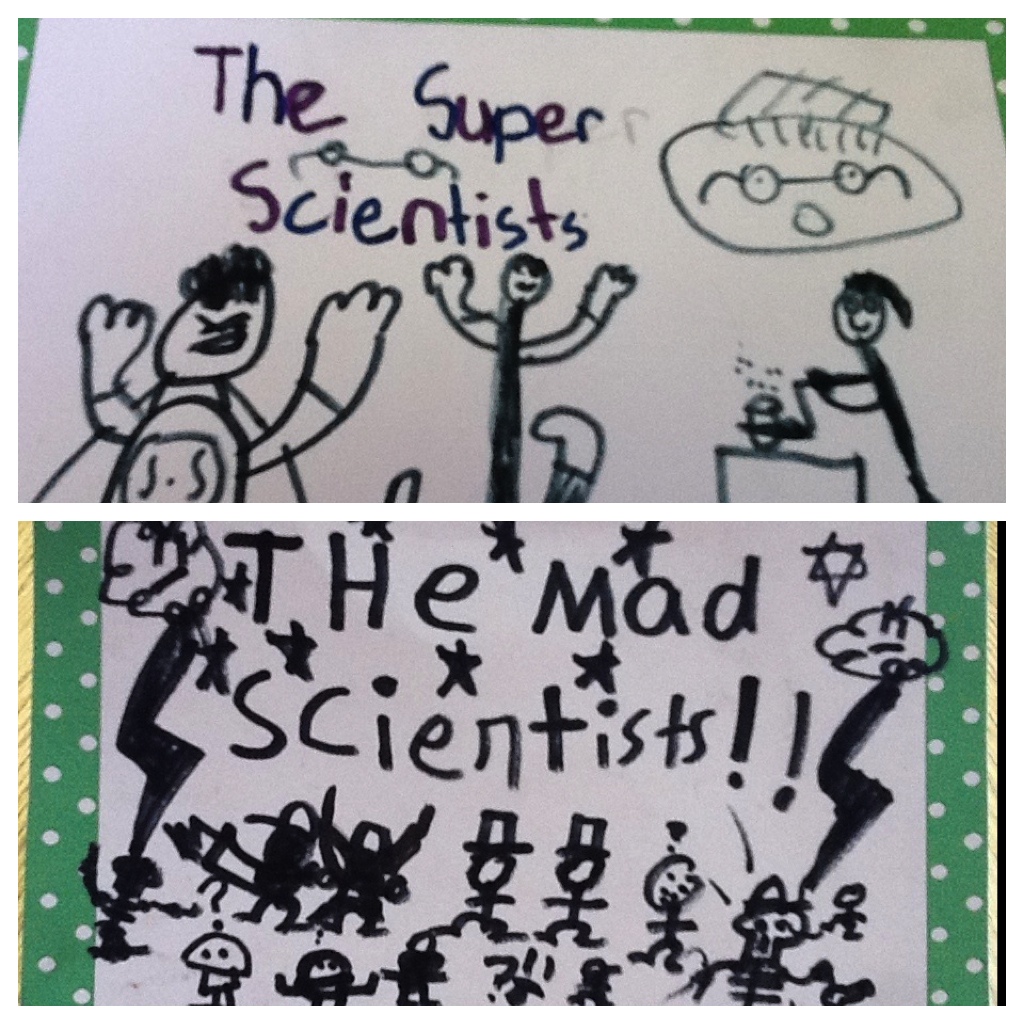
The prompts on the charts guide the students and help them have more meaningful scientific conversations about their learning and discoveries. As a result, each student has developed an identity as a scientist who is curious about the world and knows how to search for answers and share scientific results and thinking with others.
Best of luck,
Liz, Jenna, Nicole, and Katie
And Happy Charting!
Marjorie & Kristi


LOVE LOVE LOVE! Two things I so appreciate in this post: 1. The format of the charts providing meta-coaching: the charts are teaching kids to elaborate, organize, and label, and they are beautifully elaborated, organized, and labeled themselves. 2. The small, portable versions of charts for kids to use. No more excuses about not enough wall space! Also, kids can choose the charts they need. I’ve seen a lot of ways to design mini-charts and this is one of my favorites. The preparation and care that the teachers put into this unit is so apparent, and I have no doubt that the kids’ writing skyrocketed.
Reblogged this on The Curriculum Corner.
Thank you for all the detail about your charts. I’ll bet your kids’ science writing is wonderful based on this work. You always help me think more deeply about my anchor charts and how I’m supporting my young learners.
[…] Charting Science Writing (Encore) […]
[…] with charts. Copy a piece of student writing, glue it to a chart, and annotate the craft moves the writer […]
These are all great ways to chart science! Have you heard of Teacher Sherpa? They also have a great way to chart science https://teachersherpa.com/template/Parts-of-a-Plant-Foldable/3177cf7c-8664-4fdb-882c-517c467f1f1a/details?search=science&afmc=1dff9279-3f2a-4ead-a40f-546b3e9584f3